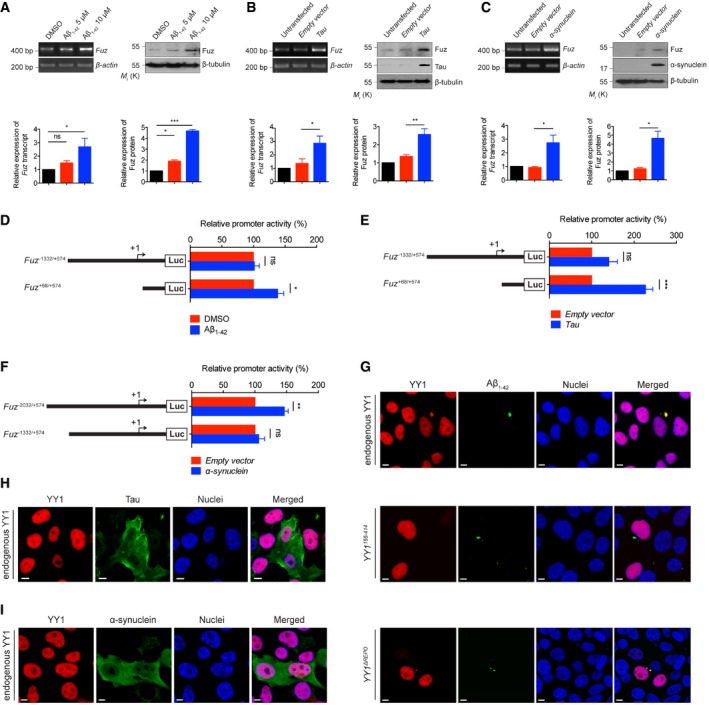
HEK293 cells treated with Aβ1–42 peptide showed induction of Fuz/Fuz at both mRNA and protein levels. Lower panel shows the quantification of Fuz transcript and protein expression relative to controls. Error bars represent s.e.m., n = 3. Statistical analysis was performed using one‐way ANOVA followed by post hoc Tukey's test. ns represents no significant difference. *P < 0.05, ***P < 0.001.
HEK293 cells transfected with Tau caused an increase in the expression levels of both Fuz transcript and Fuz protein. Lower panel shows the quantification of Fuz transcript and protein expression relative to controls. Error bars represent s.e.m., n = 3. Statistical analysis was performed using two‐tailed unpaired Student's t‐test. *P < 0.05. **P < 0.01.
The mRNA and protein expression of Fuz/Fuz levels were elevated in α‐synuclein‐expressing HEK293 cells. Lower panel shows the quantification of relative Fuz transcript and protein expression relative to controls. Error bars represent s.e.m., n = 3. Statistical analysis was performed using two‐tailed unpaired Student's t‐test. *P < 0.05.
Luciferase assay was performed to examine human Fuz promoter activity in Aβ1–42‐treated HEK293 cells. The activity of Fuz
+68/+574, but not Fuz
−1332/+574 was upregulated in Aβ1–42‐treated cells. Error bars represent s.e.m., n = 5. Statistical analysis was performed using two‐tailed unpaired Student's t‐test. ns represents no significant difference. *P < 0.05.
Luciferase assay was performed to examine human Fuz promoter activity in Tau‐expressing HEK293 cells. Overexpression of Tau induced the transcriptional activity of Fuz
+68/+574. Error bars represent s.e.m., n = 5. Statistical analysis was performed using two‐tailed unpaired Student's t‐test. ns represents no significant difference. ***P < 0.001.
Luciferase assay was performed to examine human Fuz promoter activity in α‐synuclein‐expressing HEK293 cells. The activity of Fuz
−2032/+574, but not Fuz
−1332/+574 was upregulated in α‐synuclein‐expressing cells. Error bars represent s.e.m., n = 5. Statistical analysis was performed using two‐tailed unpaired Student's t‐test. ns represents no significant difference. **P < 0.01.
YY1 protein was sequestered to the Aβ1–42 aggregates (green) in HEK293 cells. Endogenous YY1 (red) was stained with anti‐YY1 antibody. YY1ΔREPO, but not YY1155–414 protein (red), was sequestered to the Aβ1–42 aggregates (green) in HEK293 cells. Cell nuclei (blue) were stained with Hoechst 33342. Scale bars: 5 μm. n = 3.
YY1 protein was not sequestered to the Tau aggregates (green) in HEK293 cells. Endogenous YY1 (red) was stained with anti‐YY1 antibody. Cell nuclei (blue) were stained with Hoechst 33342. Scale bars: 5 μm. n = 3.
The nuclear localization of YY1 was not changed in α‐synuclein‐expressing HEK293 cells. Endogenous YY1 (red) was stained with anti‐YY1 antibody. Cell nuclei (blue) were stained with Hoechst 33342. Scale bars: 5 μm. n = 3.
or beta‐tubulin was used as loading control.
represents the number of biological replicates. Only representative images, gels and blots are shown.

