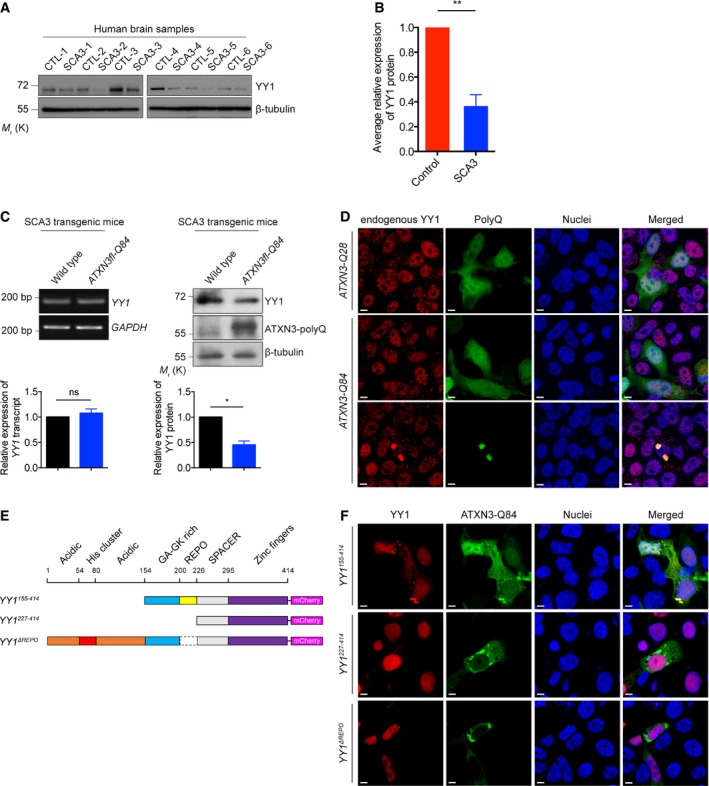
Figure 6. Soluble YY1 protein level is reduced in polyQ diseases.

-
A, B(A) Soluble YY1 protein level was reduced in SCA3 patient brain samples versus age‐matched controls. Background information on the control and patient brains are summarized in Appendix Tables S2 and S3. (B) is the quantification of (A). Error bars represent s.e.m., n = 6. Statistical analysis was performed using two‐tailed unpaired Student's t‐test. **P < 0.01.
-
CExpression of soluble YY1 protein, but not YY1 transcript, was reduced in the brains of 6‐month‐old SCA3 transgenic mice. Lower panel shows the quantification of YY1 transcript and protein expression relative to controls. Error bars represent s.e.m., n = 3. Statistical analysis was performed using two‐tailed unpaired Student's t‐test. ns represents no significant difference. *P < 0.05.
-
DYY1 protein was sequestered to the ATXN3‐Q84 protein aggregates (green) in HEK293 cells, while its nuclear localization was not affected in ATXN3‐Q28‐expressing cells or cells with no ATXN3‐Q84 protein aggregate detected. Endogenous YY1 (red) was stained with anti‐YY1 antibody. Cell nuclei (blue) were stained with Hoechst 33342. Scale bars: 5 μm. n = 3.
-
ESchematic representation of the domain structure of the human full‐length and truncated YY1 proteins used in this study.
-
FYY1155–414, but not YY1227–414 and YY1ΔREPO proteins (red), was sequestered to the ATXN3‐Q84 protein aggregates (green) in HEK293 cells. Cell nuclei (blue) were stained with Hoechst 33342. Scale bars: 5 μm. n = 3.
