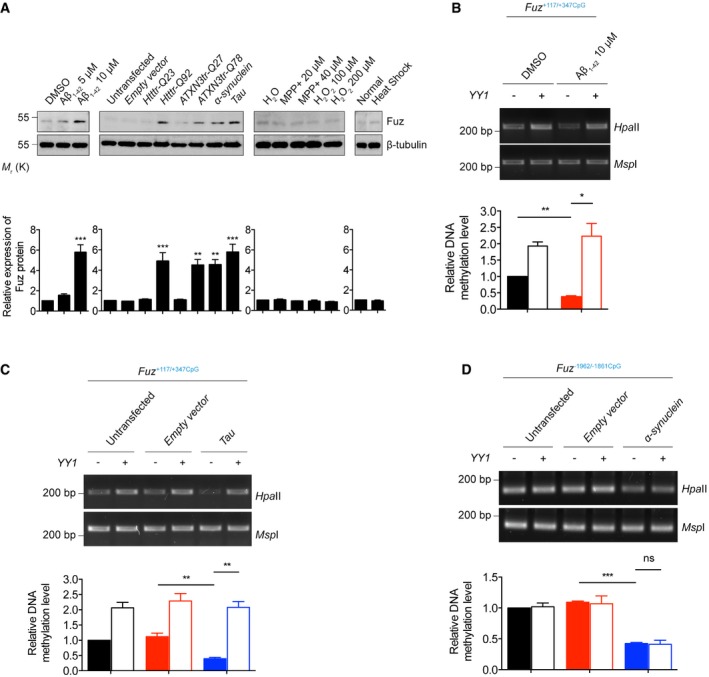
Rat primary cortical neurons treated with Aβ1–42 peptide, or transfected with Htttr‐Q92, ATXN3tr‐Q78, α‐synuclein, Tau constructs induced Fuz protein expression. Such induction was not observed in neurons treated with MPP+, H2O2 or heat shock. Lower panel shows the quantification of Fuz protein expression relative to controls. Error bars represent s.e.m., n = 3. Statistical analysis was performed using one‐way ANOVA followed by post hoc Tukey's test. **P < 0.01, ***P < 0.001.
Overexpression of YY1 promoted the hypermethylation of Fuz
+117/+347CpG in the DMSO‐treated HEK293 cells. Treatment of Aβ1–42 caused hypomethylation of Fuz
+117/+347CpG, while such hypomethylation was restored by YY1 overexpression. Lower panel shows the quantification of DNA methylation level of Fuz
+117/+347CpG relative to controls. Error bars represent s.e.m., n = 3. Statistical analysis was performed using one‐way ANOVA followed by post hoc Tukey's test. *P < 0.05, **P < 0.01.
Overexpression of YY1 promoted the hypermethylation of Fuz
+117/+347CpG in the untransfected or empty vector‐transfected HEK293 cells. The Tau‐mediated hypomethylation of Fuz
+117/+347CpG was rescued by YY1 overexpression. Lower panel shows the quantification of DNA methylation level of Fuz
+117/+347CpG relative to controls. Error bars represent s.e.m., n = 3. Statistical analysis was performed using one‐way ANOVA followed by post hoc Tukey's test. **P < 0.01.
Overexpression of YY1 did not change the methylation of Fuz
−1962/−1861CpG in the untransfected or empty vector‐transfected HEK293 cells. The α‐synuclein‐mediated hypomethylation of Fuz
−1962/−1861CpG was not restored by YY1 overexpression. Lower panel shows the quantification of DNA methylation level of Fuz
−1962/−1861CpG relative to controls. Error bars represent s.e.m., n = 3. Statistical analysis was performed using one‐way ANOVA followed by post hoc Tukey's test. ns represents no significant difference. ***P < 0.001.
Data information: Beta‐tubulin was used as loading control.
represents the number of biological replicates. Only representative gels and blots are shown.

