
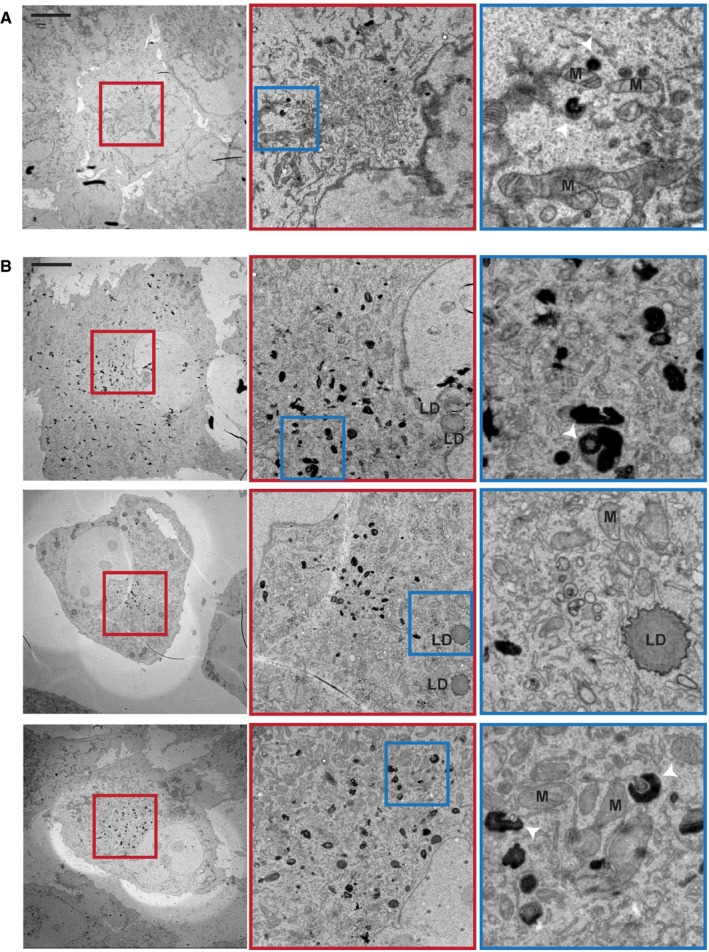
Figure EV2. Ultrastructural analysis of TMEM41B KO cells.
-
A, BH4 Cas9 (A) and H4 Cas9 TMEM41B KO clone 6 (B) cells were analyzed by transmission electron microscopy. Representative images are shown at the level of the entire cell, the juxtanuclear space as well as an inlet thereof. Mitochondria (M), lipid droplets (LD), and electron‐dense structures (white arrowheads) are indicated. Scale bar: 10 μm.