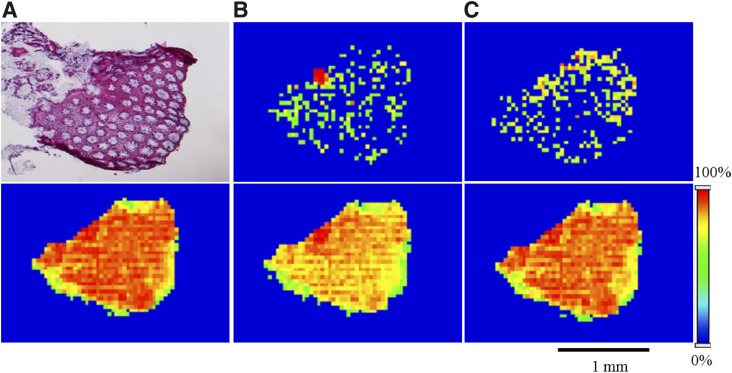
Fig. 2.
Spatial distribution of TFV, TFV-DP, PC (34:1), PC (16:0/OH), and PC (36:2) in a colorectal tissue section of a subject received a TFV-containing enema. (A, upper panel) H&E stain indicating tissue anatomy and orientation. MALDI MS ion images of (B, upper panel) TFV and (C, upper panel) TFV-DP revealing their heterogeneous distribution across the colorectal tissue section. In contrast, lipid species, (A, lower panel) PC (34:1), (B, lower panel) PC (16:0/OH), and (C, lower panel) PC (36:2) exhibiting relative homogeneity in their distribution. Spatial resolution for MALDI MS ion images was 50 μm. The red color represents the highest signal intensity (100%), whereas the blue color represents the lowest signal (0%) of the ion of interest. Scale bar, 1 mm.

