Fig. 2.
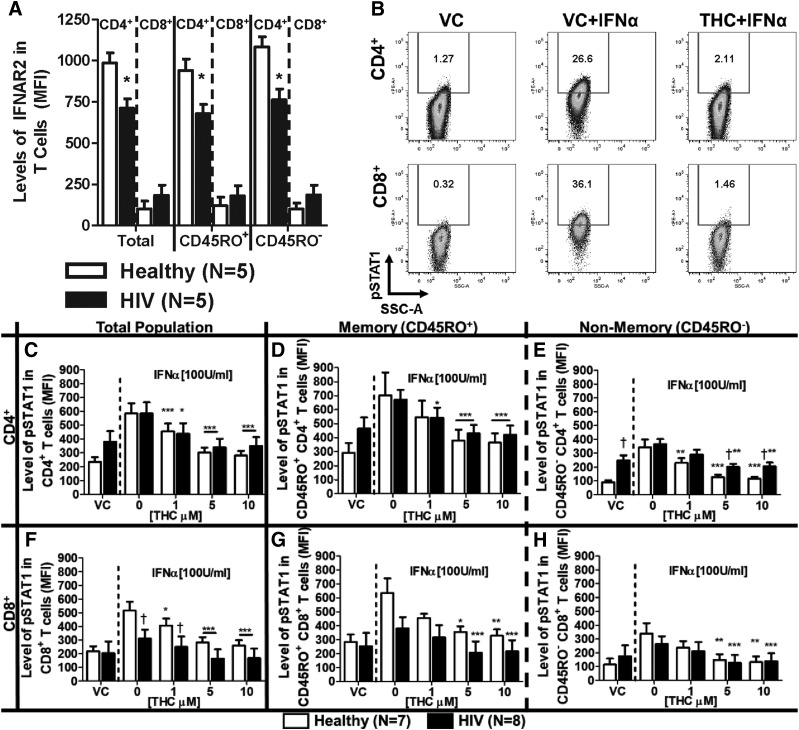
T cells from healthy and HIV+ donors exhibit different profiles of IFNΑR2 expression and IFNα-induced STAT1 phosphorylation, which is suppressed by THC. PBMCs from healthy and HIV+ donors were isolated by Ficoll Paque density gradient centrifugation and used for the determination of either IFNΑR2 surface expression or IFNα-induced STAT1 phosphorylation (pSTAT1). (A) IFNAR2 expression was quantified by flow cytometry using the mean fluorescence intensity (MFI). For pSTAT1, PBMCs were treated with either vehicle (0.03% EtOH) or THC (1, 5, or 10 µM) in 0.03% EtOH for 30 minutes before stimulation with 100 U/ml IFNα for 30 minutes. (B) Representative experiment of IFNα-mediated pSTAT1 induction and THC (10 µM)-mediated suppression in T cells from a healthy donor. The effects of THC on IFNα-pSTAT1 induction in: total (C), memory (D) and nonmemory (E) CD4+ T cells; and total (F), memory (G), and nonmemory (H) CD8+ T cells. For IFNΑR2 expression, asterisks indicate statistically significant differences (*P < 0.05) of MFI in HIV compared with type-matched T cells from healthy donors. For pSTAT1, asterisks indicate statistically significant differences of the treatment with the HIV status–matched VC (0 THC) (*P < 0.05; **P < 0.01; ***P < 0.001). Daggers indicate statistically significant differences of treatment-matched groups between T cells from healthy and HIV+ donors (†P < 0.05) (two-way analysis of variance with Bonferroni multiple-comparisons post-test). SSC-A, side scatter area.

