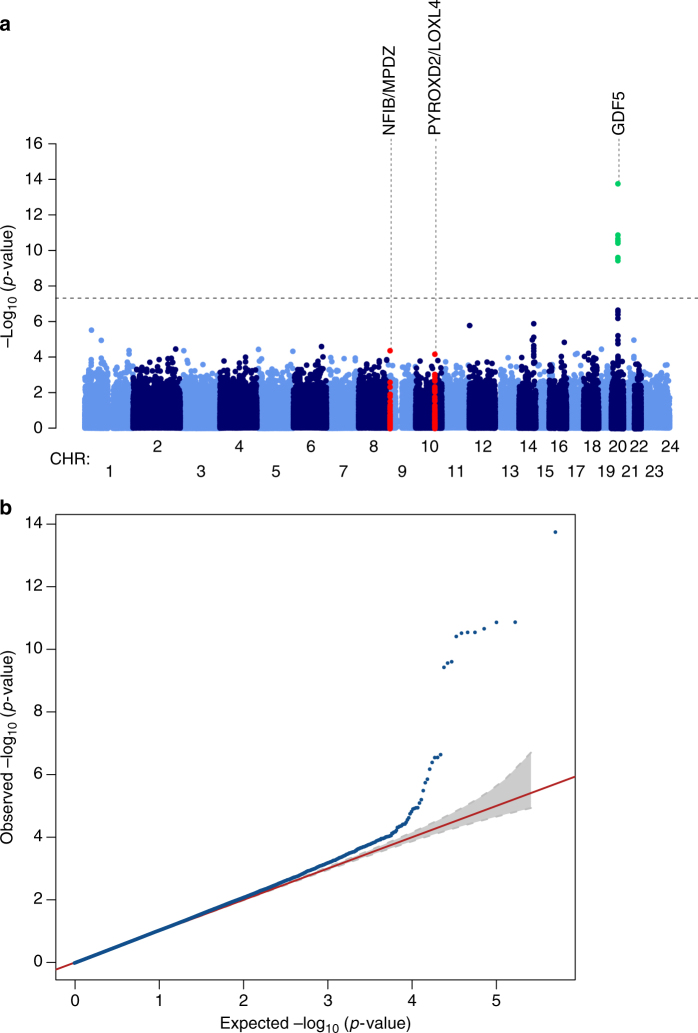
Fig. 2.
Manhattan and quantile–quantile plot of the DDH genome-wide association scan. a The dashed line indicates the genome-wide significance threshold (P = 5.0 × 10⁻⁸). Green dots represent variants for which P-values reached the genome-wide significance threshold and red dots illustrate the other two replicating signals. Chromosomes X and pseudo-autosomal regions on the chromosome X are represented by number 23 and 24, respectively. b Quantile–quantile plot of the data used in the GWAS

