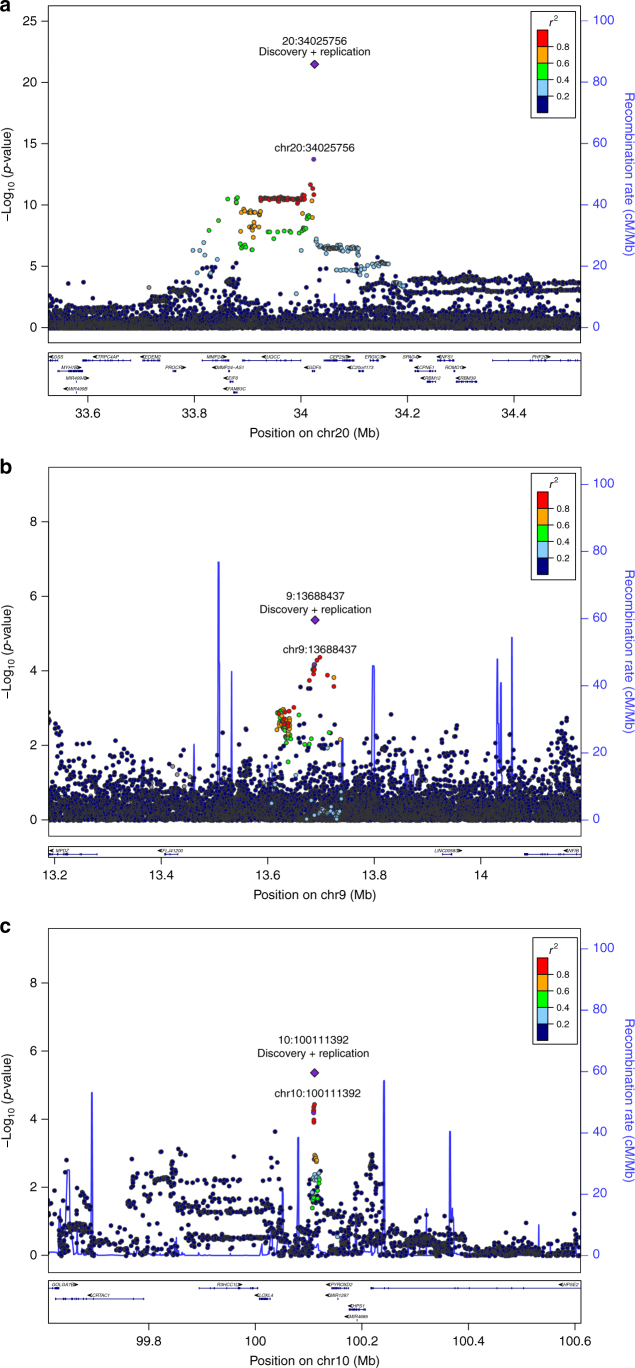
Fig. 3.
Regional association plots of the three replicating signals. Regional association plot of rs143384 (20:34025756) (a), rs4740554 (9:13688437) (b) and rs4919218 (10:100111392) (c). Each filled circle represents the P-value of analysed variants (as −log10 P-values) plotted against their physical position (NCBI Build 37). The P-value at the discovery stage and combined discovery and replication cohorts is represented by a purple circle and diamond, respectively. The other variants in the region are coloured depending on their degree of correlation (r2) with the index variant according to a scale from r2 = 0 (blue) to r2 = 1 (red). Gene location is annotated based on the UCSC genome browser

