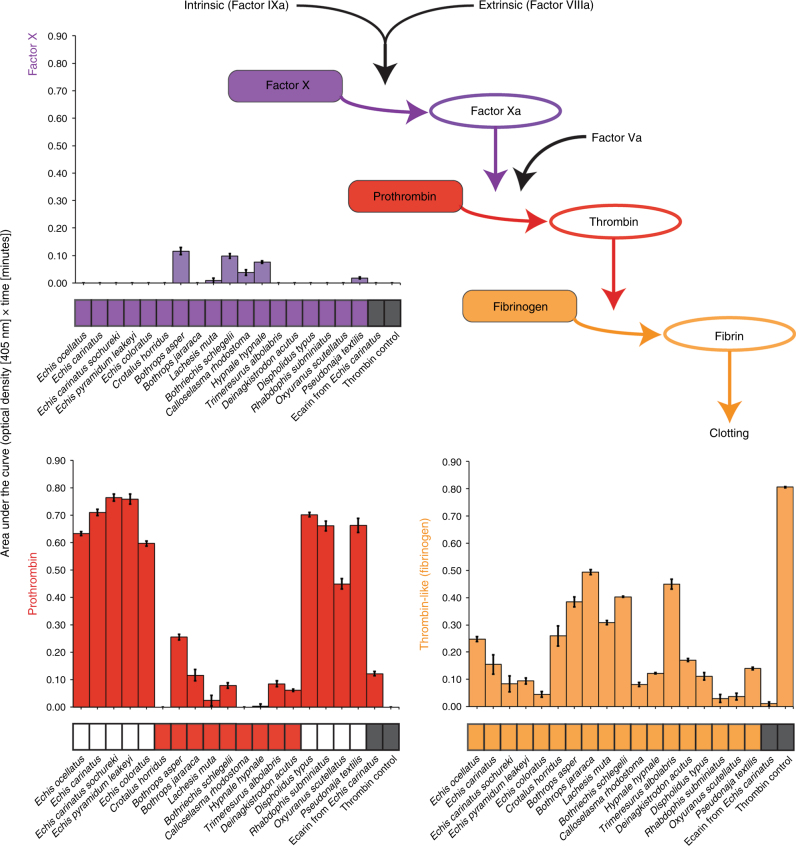
Fig. 2.
The bioactivity of procoagulant snake venoms on key components of the coagulation cascade. The coagulation cascade schematic highlights the end of this pathway and the coagulation factors tested in our chromogenic enzyme assay. Bar charts display the functional activity of each procoagulant venom, the snake venom metalloproteinase toxin ecarin, and a thrombin control against Factor X (purple), prothrombin (red) and fibrinogen (orange). Bars represent areas under the curve of optical density (405 nm) plotted against time. Error bars represent SEM of triplicate measurements. Below each bar chart are blocks that indicate whether each venom induced clot formation in: (i) plasma deficient in Factor X (purple), (ii) plasma deficient in prothrombin (red) and normal plasma (orange) at the MCD-P dose. Coloured blocks indicate clot formation and white blocks indicate no clot formation at ten times the MCD-P dose. Grey blocks (for ecarin and thrombin) indicate not tested. See Supplementary Figs. 7 and 8 for the plotted data used for area under the curve calculations

