Fig. 6.
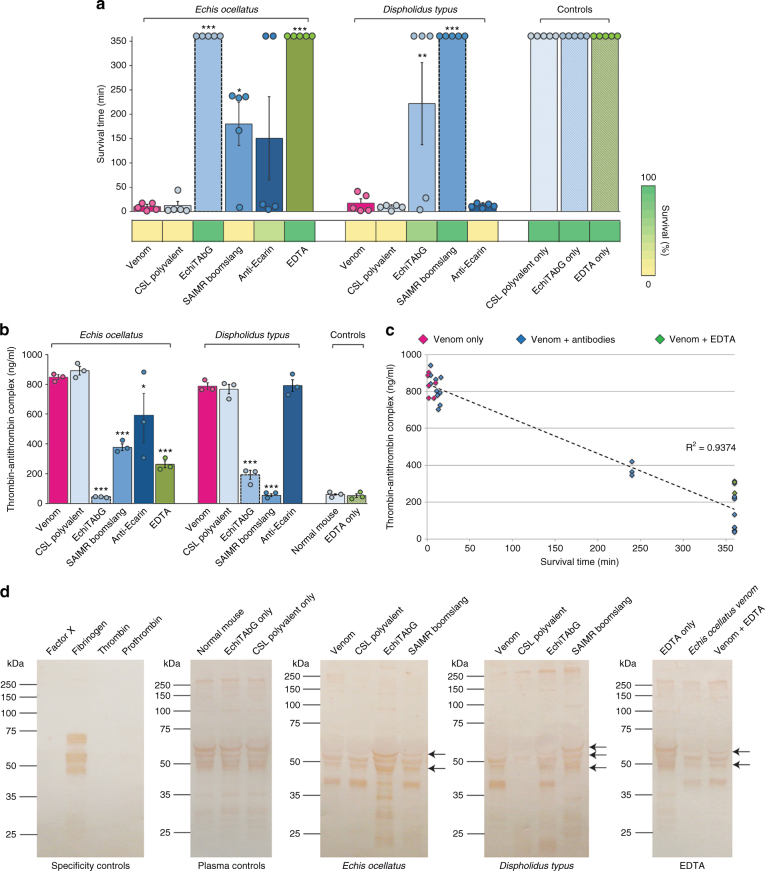
In vivo neutralisation of Echis ocellatus and Dispholidus typus venoms by homologous and heterologous antivenoms and EDTA. a The survival and duration of survival of mice treated with venom and antibodies or EDTA. Bars represent mean survival times in minutes (circles represent individual data points and error bars indicate SEM; n = 5) and coloured blocks below the chart indicate percentage survival (n = 5). Homologous antivenom−venom combinations are indicated by dashed lines around bars. Asterisks indicate significant increases in survival time compared to venom-only measurements: ***P < 0.001, **P < 0.01, *P < 0.05; one-way ANOVA with Tukey’s HSD post hoc test. b The concentration of thrombin−antithrombin complexes (TAT) in plasma from mice treated with venom and antibodies or EDTA. Circles represent individual data points and error bars indicate SEM of triplicate measurements. Homologous antivenom−venom combinations are indicated by dashed lines around bars. Asterisks indicate significant reductions in TAT concentrations compared to venom-only measurements: ***P < 0.001, **P < 0.01, *P < 0.05; one-way ANOVA with Tukey’s HSD post hoc test. c TAT levels show a strong inverse relationship with survival times (R2 = 0.9374). Note that results from controls (antivenom only, EDTA only and normal mouse pre- and post-study) are not included in this analysis as these animals received no venom. Inclusion of these data points results in a drop in R2 to 0.5203, demonstrating that the correlation observed is a result of treatment intervention and not time (i.e. factor regeneration over time). d Immunoblotting plasma from mice treated with venom and antibodies or EDTA demonstrates variation in circulating fibrinogen. Arrows highlight key variable bands (either in terms of presence or intensity) visualised with anti-fibrinogen antibodies in each panel. Mouse plasma was pooled from all experimental animals in each treatment group (n = 5). See Supplementary Fig. 6 for details of the same immunoblotting experiments using anti-prothrombin antibodies

