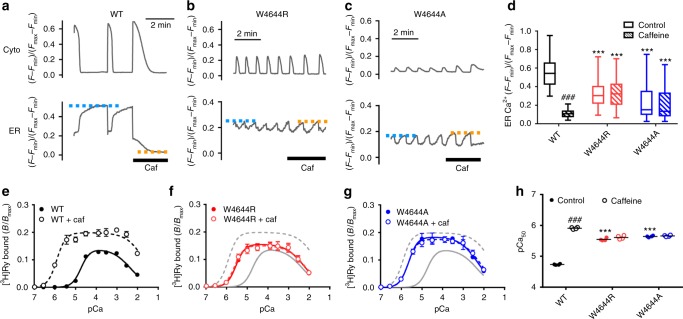
Fig. 2.
Functional analysis of tryptophan mutations in the putative caffeine-binding site in RyR2. a–c Representative traces of [Ca2+]i (Cyto) and [Ca2+]ER (ER) signals of HEK293 cells expressing WT RyR2 (a), W4644R (b) and W4644A (c) G-GECO1.1 and R-CEPIA1er were co-transfected to monitor [Ca2+]i and [Ca2+]ER, respectively. Measurements were carried out 4–6 h after induction of RyR2, where ER Ca2+ was still retained. [Ca2+] is expressed as (F − Fmin)/(Fmax− Fmin), in which Fmin and Fmax were determined in the presence of ionomycin with BAPTA and CaCl2, respectively. Caffeine (10 mM) was applied at the time indicated by the thick bar. Blue and orange dotted lines indicate upper levels of [Ca2+]ER in control and caffeine-containing Krebs solution, respectively. d Upper level of [Ca2+]ER in WT (n = 60), W4644R (n = 49), and W4644A (n = 63) RyR2 cells in control (open columns) and with 10 mM caffeine (hatched columns). Data are given as box and whisker plots displaying the minimum, first quartile, median, third quartile, and maximum values. The mutants exhibited more frequent Ca2+ oscillations with reduced [Ca2+]ER than WT and did not respond to caffeine. *** Indicates statistical significance with p < 0.0001 vs WT using one-way ANOVA followed by Dunnett’s post hoc test. ###p < 0.0001 vs control using unpaired two-tailed Student’s t-test. e–g Ca2+-dependent [3H]ryanodine binding of WT (e), W4644R (f) and W4644A (g), with (open circles) or without (closed circles) 10 mM caffeine. Data are given as mean ± SEM (n = 4). Data were fitted to Eqs. (1–3) for biphasic Ca2+ dependence using fixed Hill coefficients of 2.0 and 1.0 for activating and inactivating Ca2+ sites, respectively, for WT and all the mutants. The mutants exhibited enhanced sensitivity for activating Ca2+ compared with WT in the absence of caffeine. They did not respond to caffeine. Open and closed circles are mostly overlapped for the mutants. h Summary of pCa values for half-maximum activation (pCa50) of WT, W4644R, and W4644A with (hatched columns) or without (open columns) 10 mM caffeine. Data are given as mean (horizontal bar) and individual values (circles). *** Indicates statistical significance with p < 0.0001 vs WT using one-way ANOVA followed by Dunnett’s post hoc test. ###p < 0.0001 vs control using unpaired two-tailed Student’s t-test

