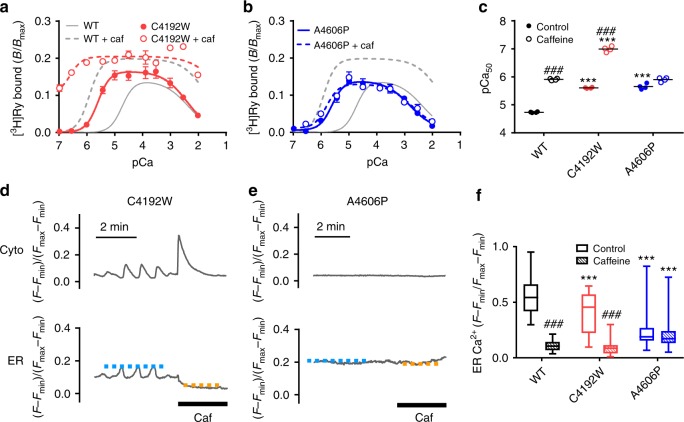
Fig. 7.
Disease-associated mutations with enhanced Ca2+ sensitivity located near the caffeine-binding site. a, b Ca2+-dependent [3H]ryanodine binding to C4192W (a) and A4606P (b) with (open circles) or without (closed circles) 10 mM caffeine. Data are given as mean ± SEM (n = 4). c Summary of pCa50 values of WT, C4192W and A4606P with (hatched columns) or without (open columns) 10 mM caffeine. The two mutants exhibited similar enhancement in Ca2+ sensitivity but responded differentially to caffeine. Data are given as mean (horizontal bar) and individual values (circles). ***Indicates statistical significance with p < 0.0001 vs WT using one-way ANOVA followed by Dunnett’s post hoc test. ###p < 0.0001 vs control using unpaired two-tailed Student’s t-test. d Representative traces of [Ca2+]i (cyto) and [Ca2+]ER (ER) signals of HEK293 cells expressing C4192W and A4606P. Measurements were carried out 4–6 h after induction of RyR2 when ER Ca2+ was still retained. Caffeine (10 mM) was applied at the time indicated by the thick bar. C4192W cells showed Ca2+ oscillations and responded to caffeine. In contrast, A4606P cells did not show any Ca2+ oscillation nor caffeine-induced Ca2+ release (right). Blue and orange dotted lines indicate upper levels of [Ca2+]ER in control and caffeine-containing Krebs solution, respectively. e Upper level of [Ca2+]ER in C4192W (n = 42) and A4606P (n = 61) RyR2 cells for control (open columns) and 10 mM caffeine treatment (hatched columns) compared with WT (n = 60). Data for WT are the same with those in Fig. 2d. Data are given as box and whisker plots. ***Indicates statistical significance with p < 0.0001 vs WT using one-way ANOVA followed by Dunnett’s post hoc test. ###p < 0.0001 vs control using unpaired two-tailed Student’s t-test

