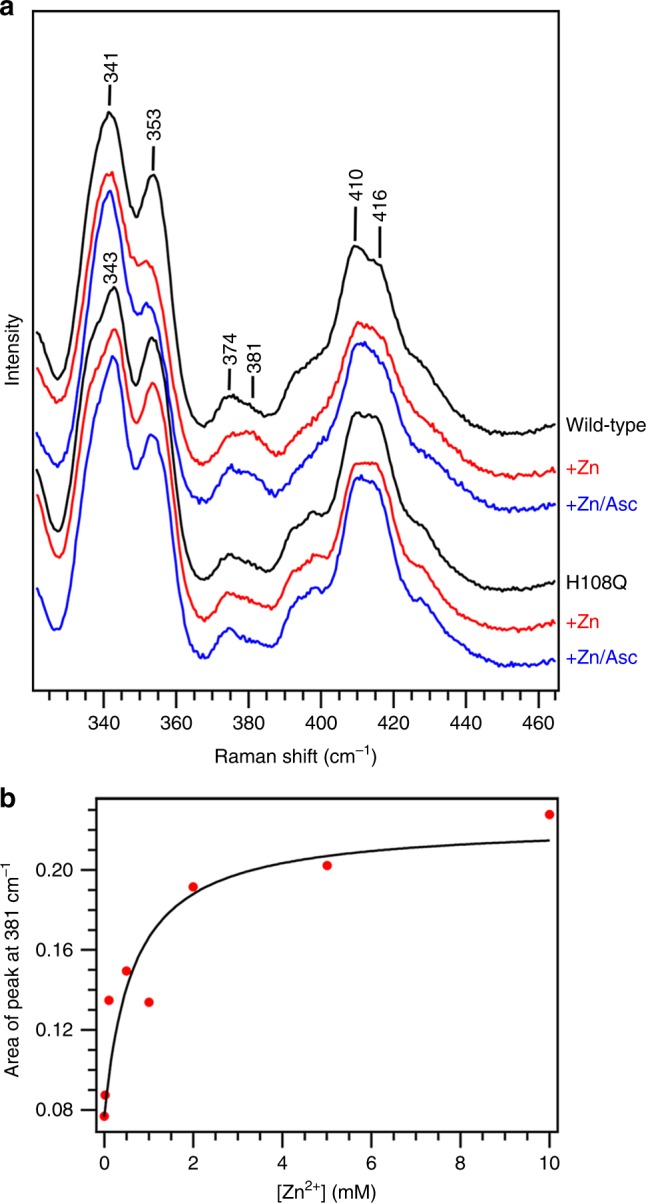
Fig. 3.

Resonance Raman analysis of Zn2+ binding to reduced Dcytb. a The low frequency region of the resonance Raman spectrum of Dcytb in the absence and presence of ZnCl2 (5 mM) or ZnCl2 (5 mM) and ascorbate (20 mM) are shown for the wild-type and H108Q variant proteins. b The titration of reduced wild-type Dcytb with Zn2+ as monitored by resonance Raman spectroscopy at 381 cm−1. The peak areas at 381 cm−1 are plotted as red circles as a function of [Zn2+]. The black curve represents a fit of the data to Eq. 2 to provide an estimated Kd of 0.5 ± 0.1 mM
