Fig. 5.
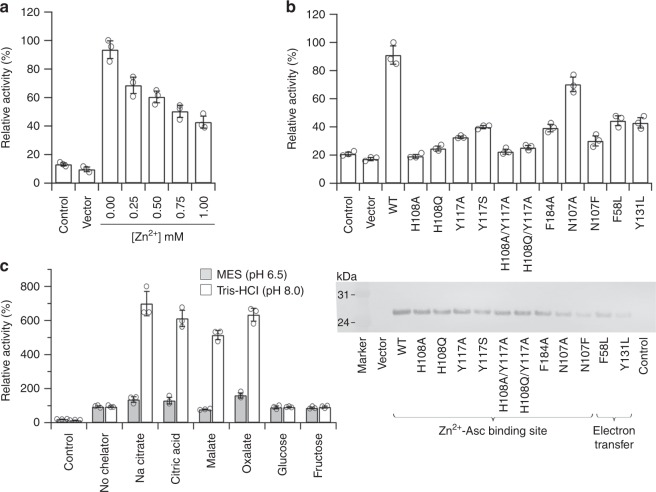
Ferric reductase activity of Dcytb. The values indicated are means ± S.D. of data from duplicate sets of samples analyzed in triplicate. The “Control” means that the Dcytb expression was suppressed in the transformant of wild-type dcytb cDNA-inserted vector, and the “Vector” shows that the expression vector (no insertion of dcytb gene) was transformed and the assay was performed in the same manner as with cultures of the wild-type and other variants. Dot-plot (empty circles) shows the data distribution. a Competitive binding between Fe3+ and Zn2+ in wild-type Dcytb. The value of 0 mM (~220 nmol 106 cells−1 h−1) was set to 100% and the relative activity was obtained for increasing Zn2+ concentration. b Fe3+ reductase activities of the structure-guided mutants of Dcytb. Western blot of whole cell lysates of Dcytb-expressed yeasts (1.0 μg protein per lane) shown at the bottom. The original blot is represented in Supplementary Fig. 7. c Effect of dietary metal-chelators on Fe3+ reductase activity in wild-type Dcytb. The effect of chelators was tested in MES buffer (pH 6.5) and Tris-HCl buffer (pH 8.0). The activity without chelator for MES buffer (~195 nmol 106 cells−1 h−1) and Tris-HCl buffer (~65 nmol 106 cells−1 h−1) was set to 100%, and the relative activity with chelators was calculated for respective buffers

