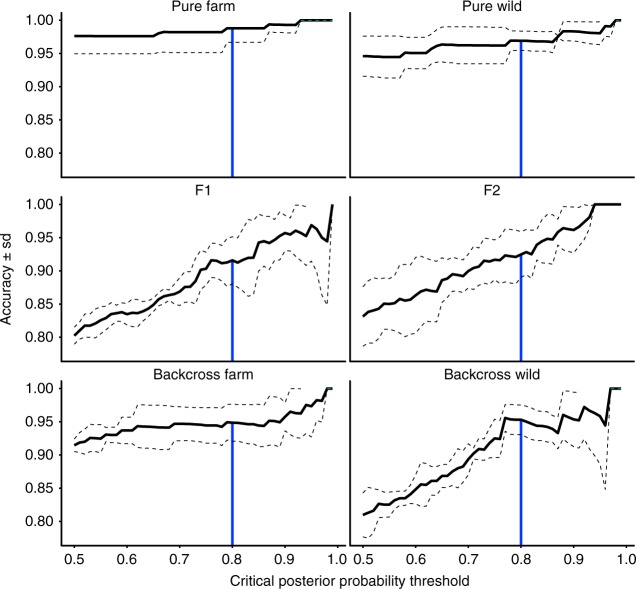
Fig. 2.
Accuracy of detection of each of the genotype frequency classes across a range of critical posterior probability thresholds for the 95 SNP panel used in this study. The black line represents the mean of three replicate analyses of each of three independently simulated datasets and the dotted lines are the standard deviation. The vertical blue line is meant to highlight the critical posterior probability of assignment threshold (>0.8) used in this study

