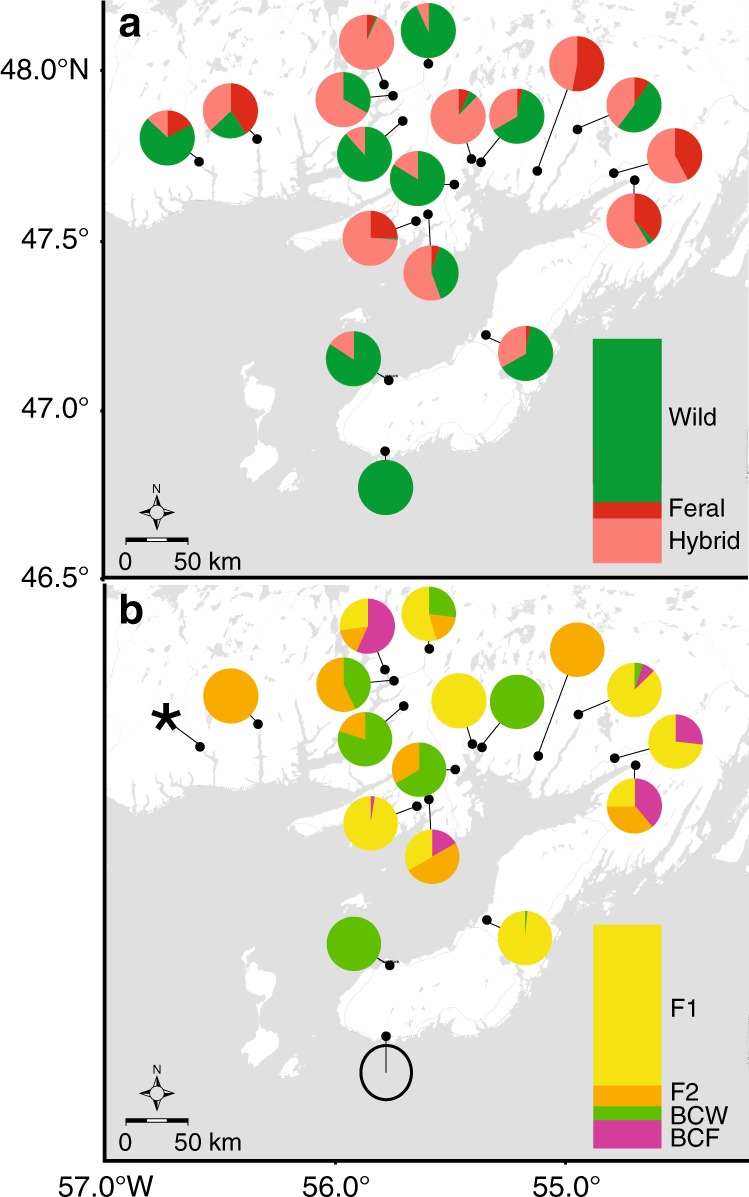
Fig. 3.

Distribution and extent of hybridization following a large escape event of domestic Atlantic salmon. a Geographic distribution of wild, feral, or hybrid young-of-the-year Atlantic salmon across sample locations in 2014. b River-specific proportions of hybrid young-of-the-year salmon partitioned by hybrid genotype class (i.e., F1, F2, backcross wild (BCW), and backcross farm (BCF)). The open circle indicates a sample in which no hybrids were found, the asterisk signifies a location where accurate assignment to hybrid class was not possible. Bar graphs represent the overall proportions of each class in the entire sampling range, taking into account the varying sizes of the sampled populations (i.e., weighting by the axial distance, the distance along a straight line along the longest axis of the river), and colors therein are used as the legend
