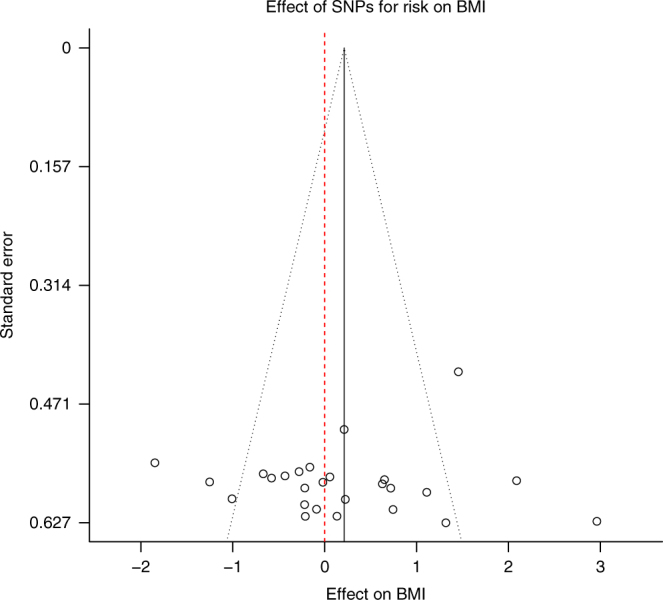
Fig. 2.

Effect of genome-wide significant SNPs for risk-taking on BMI. Each data point represents one of the 26 risk-associated SNPs. The SNP-specific MR estimate for the association of risk-taking with BMI (x axis) is plotted against the SE (y axis). The summary estimate is marked by the solid black line. The grey-dotted lines, originating from the summary estimate, represent 95% confidence limits. The red-dotted line indicates the null
