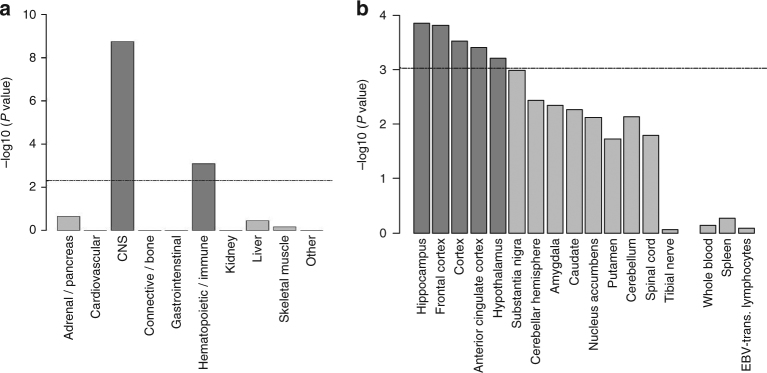
Fig. 3.
Tissue enrichment for risk-taking associated loci. a When tissues and cells are grouped together, GTEx analysis shows that genes within risk-taking loci are enriched for expression in the central nervous system (CNS) and hematopoietic/immune system. The dotted line indicates the threshold for statistically significant enrichment, established using the Bonferroni-corrected P value of partitioned heritability calculated by stratified LD score regression. b GTEx analysis shows enriched expression of genes within risk-taking loci in particular brain regions. The dotted line indicates the threshold for statistically significant enrichment, established using the Bonferroni-corrected P value of partitioned heritability calculated by stratified LD score regression

