Fig. 4.
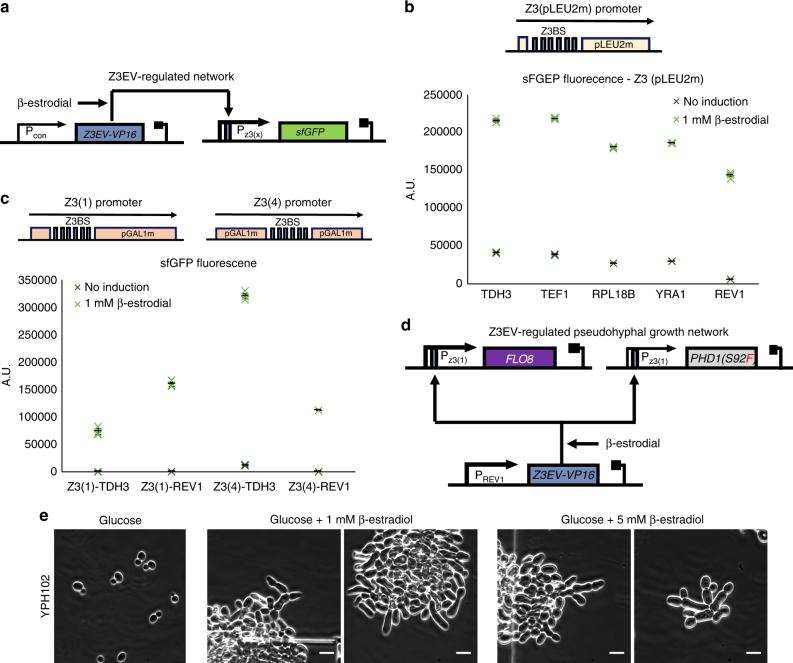
Extending external inducible pseudohyphal growth to glucose-rich media. a Diagram of the Z3 promoter characterization system. The yEGFP fluorescent marker is under the control of one of the three Z3 promoter derivatives, activated by the Z3EV-VP16 transcription factor in the presence of β-estradiol. Z3EV-VP16 is expressed from a constitutive promoter. Genes are shown as colored boxes, promoters as arrows. Z3EV-VP16 regulation sites are shown as blue rectangles within the promoters. b Characterization of the Z3(pLEU2) promoter when paired with different combinations of constitutive promoters driving Z3EV-VP16 expression (TDH3, TEF1, RPL18B, YRA1, or REV1). The yEGFP fluorescent output of five different constructs is tested when induced with 1 mM of β-estradiol for 5 h. Data shows fluorescence values from three repeats (colored X markers) as determined by flow cytometry, black bars indicate mean values, error bars indicate standard error. c Characterization of the Z3(1) and Z3(4) promoters when paired with either the TDH3 or REV1 constitutive promoters driving Z3EV-VP16 expression. The green fluorescence output of the four different constructs is tested when induced with 1 mM of β-estradiol for 5 h. Data shows fluorescence values from three repeats (colored X markers) as determined by flow cytometry, black bars indicate mean fluorescence values, error bars indicate standard error. d Diagram of the final Z3EV-regulated pseudohyphal growth network. Both the FLO8 and PHD1(S92F) genes are under the control of the Z3(1) promoter while Z3EV-VP16 is expressed from the constitutive REV1 promoter. Genes are shown as colored boxes while promoters as arrows. Z3EV-VP16 regulation sites are shown as blue rectangles within promoters. e Inverted microscope images of the haploid YPH102 strain taken after 28 h of growth inside the ONIX microfluidic platform in glucose media without β-estradiol or with either 1 or 5 mM of β-estradiol supplemented. Brightfield images were acquired using a 60× objective. Small white lines are scales and correspond to 10 μm

