Fig. 1.
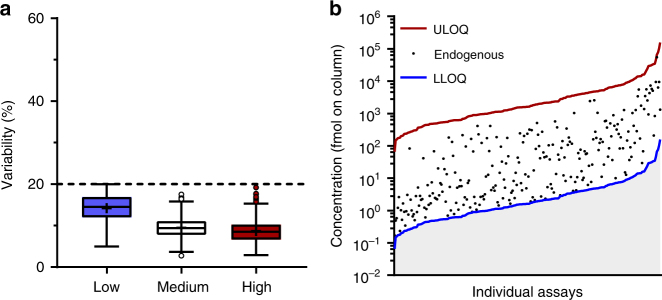
Repeatability and dynamic range of designed assays (CPTAC Experiment 2). a Total variability of peak areas, as calculated from the intra-assay and inter-assay CoVs across five independent experiments. Box and whisker plots were generated using the Tukey method; mean (+) and outliers (circles) are shown. Blue, white, and red boxes correspond to the total variability at low (2.5× or 5× assay LLOQ), medium (50× assay LLOQ) and high (500× assay LLOQ) concentrations of the spiked-in SIS peptide, respectively. The dotted line represents the 20% cut-off, as defined by CPTAC. b The dynamic range of the designed assays. Assay LLOQ (blue line), assay ULOQ (red line), and the detectable concentrations of the respective endogenous analyte (black dots, N = 367) in pooled plasma of C57BL/6 mice (N = 30) are shown

