Fig. 2.
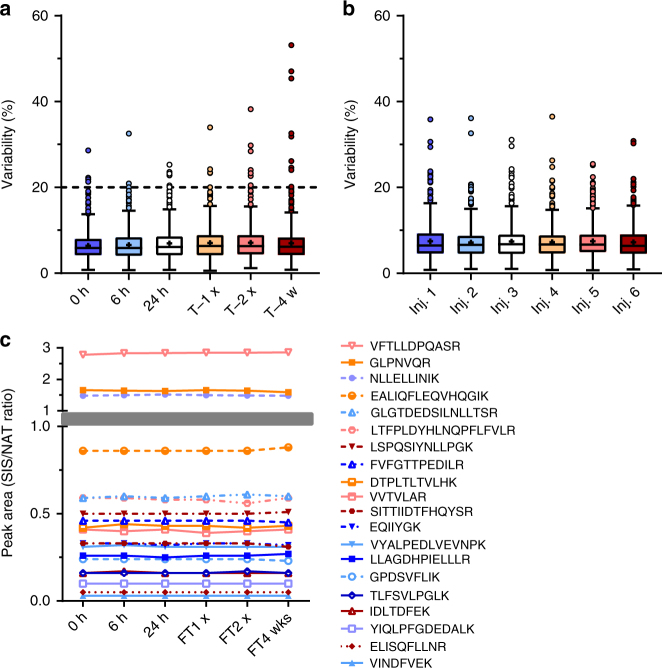
Stability of designed assays (CPTAC Experiment 4). a Intra-assay variability in SIS/NAT peak area ratio. Triplicate aliquots of the samples were analyzed by duplicate LC/MRM-mass spectrometry injections after 0, 6, or 24 h on the autosampler (4 °C). Additional aliquots were frozen at −80 °C, and analyzed identically after thawing (T−1×), after a second freeze-thaw cycle (T−2×), or after 4 weeks at −80 °C (T−4w). b Inter-assay variability in SIS/NAT peak area ratios comparing each of the six injections across all time points and freeze-thaw cycles. Box and whisker plots were generated using the Tukey method; mean (+) and outliers (circles) are shown. The dotted line represents the 20% cut-off, as defined by CPTAC. c SIS/NAT peak area ratios of 20 representative peptides across six experimental time points. T, freeze-thaw; w, weeks; Inj, injection

