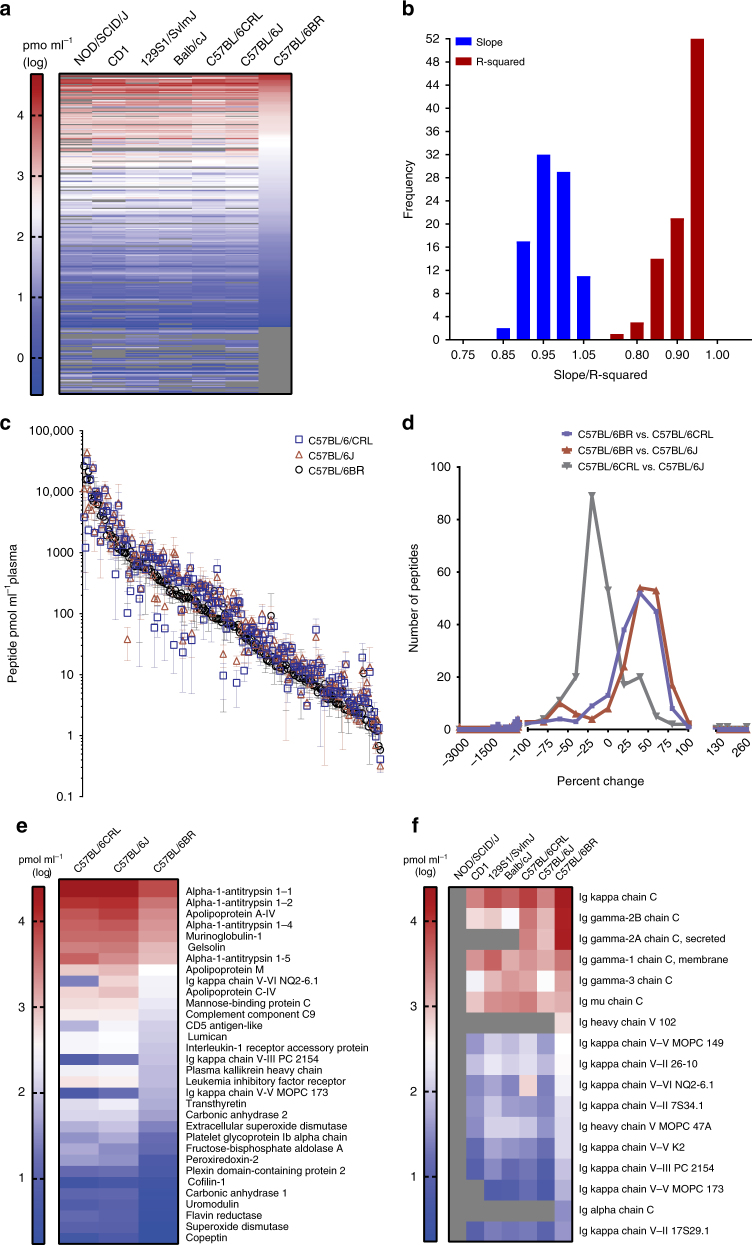
Fig. 3.
Plasma protein profiles of five laboratory mouse strains. a Heat map presenting plasma protein abundances (log-transformed) in each mouse strain (male and female protein abundance were combined). b Frequency distribution of the slope and R2 values calculated from 91 distinct linear regression analyses of plasma protein abundance (log transformed) across all male and female mouse strains and colonies (5 strains, 7 colonies, male and female separated, resulting in 91 distinct linear regression curves). c Intra-strain comparison of the abundance of plasma proteins in C57BL/6 mice obtained from three different vendors (y axis is in antilog scale). d Frequency distribution of percent differences in proteins in C57BL/6 mice from three different vendors. All differences in peptide abundance are shown, including those without statistical significance. e Intra-strain variability of protein abundance in plasma of C57BL/6 mice. Only proteins whose abundances differed between at least two C57BL/6 strains are shown (p < 0.05 by two-way ANOVA with Tukey’s correction for multiple comparisons). f Strain-specific abundance of immunoglobulins (Ig) in plasma. Abundances are shown only for target analytes detected within the dynamic range of the respective assays in plasma from at least four individual mice for each mouse strain; grey coloring indicates analytes that were not detected or were not quantifiable in plasma of the respective mouse strains. N = six mice/strain (three male and three female). Means of log-transformed data are shown; concentrations are those of the surrogate peptides (pmol mL−1 of plasma). CRL, Charles River Laboratories; J, Jackson Laboratory; and BR, BioReclamationIVT

