Fig. 2.

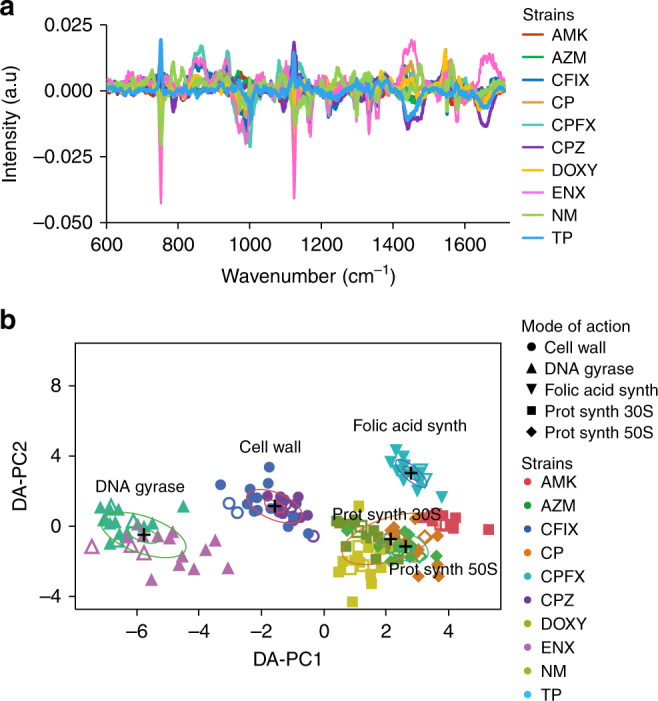
Discrimination of the mode of action of antibiotic resistance in absence of antibiotics. a Relative spectrum differences of each population of the laboratory-evolved antibiotic-resistant strains from the averaged spectrum of the parental population (n = 48). b Discrimination of the mode of antibiotic resistance on the first two DA–PC dimensions of the DA–PC model. The DA–PC was performed on the spectral differences shown in (a). The model trained on 120 population (filled markers) and 40 population chosen randomly from each cell line were used as test data (white markers). Inner and outer rings represent 95% and 50% confidence-levels, respectively. Bacterial population of the test data was classified according to their respective mode of action of antibiotic resistance with a 99.4% accuracy
