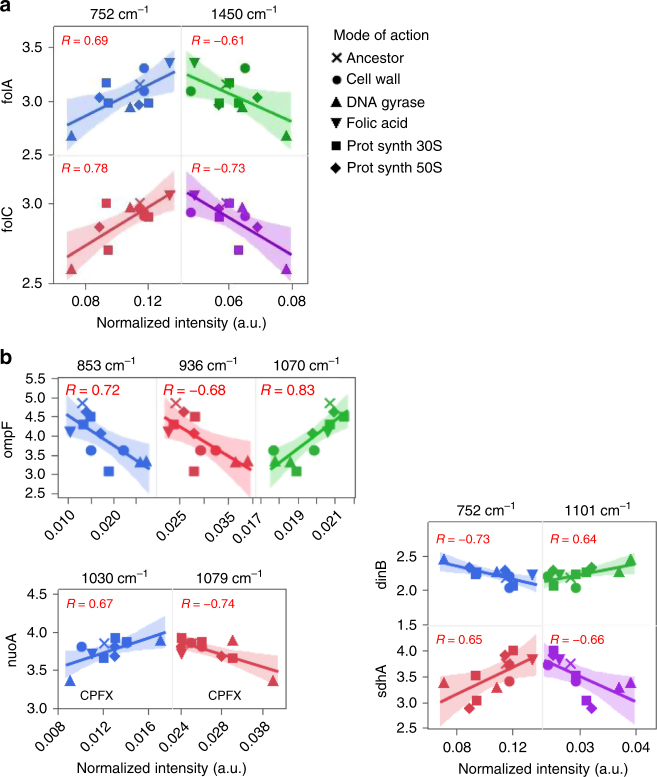
Fig. 5.
Scatterplots of normalized Raman peak intensity and normalized gene expression for folic acid synthesis (a) and other genes of interest (b). Wavelengths that helped identify these modes of actions were selected and were associated to genes known to contribute to the mode of action for folic acid synthesis or known to contribute to various antibiotic resistances were selected. A linear fit was applied to each scatterplot, and the Pearson correlation value R is displayed on each graph. Two-tailed test and FDR assessed that correlations greater than 0.601 in absolute value were significant (|R| > 0.601, FDR p < 0.05)

