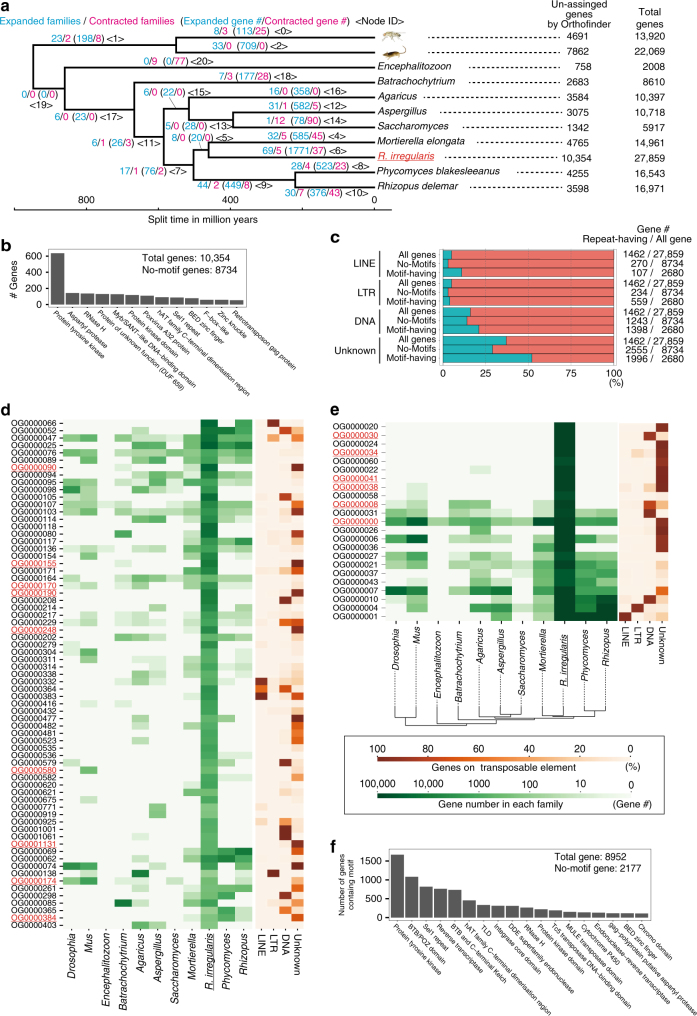
Fig. 1.
Gene inflation in R. irregularis. a Rapidly expanded/contracted ortholog groups based on CAFE analysis. Total gene number of analyzed species and unassigned genes by Orthofinder analysis (species-specific single-copy genes) are described on the right side of the tree. Illustrations were modified from the resources distributed in the Togo picture gallery (licensed under CC-BY 4.0 ©Togo picture gallery). b The number of R. irregularis-specific single-copy genes having protein motifs. Minor motifs (<50 genes) were omitted from the figure (raw-data; Supplementary Data 6). c The proportion of genes among the species-specific single-copy genes having each repeat element. d Sixty-nine rapidly expanded orthologous groups (OGs). Green heat map shows the number of genes in each OG. Orange heat map indicates the proportion of genes with each repeat element. The OGs containing the protein tyrosine kinase domain are marked in red. e Rapidly expanded OGs based on z-score analysis. The colors have the same meaning as in (d). f The number of rapidly expanded ortholog genes having protein motifs. Minor motifs (<100 genes) are omitted from the figure (raw-data; Supplementary Data 6)

