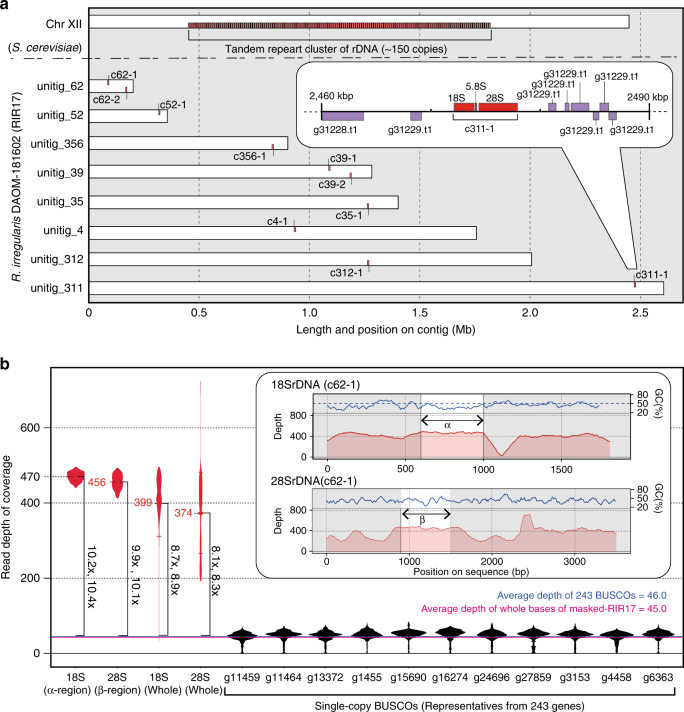
Fig. 2.
Physical maps of rDNA structures and copy numbers in RIR17. a Distribution of R. irregularis rDNA units in the genome. Each 48S rDNA unit is represented as a red box. For comparison, rDNA clusters on Saccharomyces cerevisiae chromosome XII are shown90,91. Inset is a magnified view of a 48S rDNA unit (c311-1) with nearby protein-encoding genes (purple boxes). Genes encoded by the plus-strand genome are depicted on the top side, and those encoded by the minus strand are shown on the bottom side. b Copy number of rDNA in DAOM-181602 based on the read depth of coverage. Averages of the read depth of coverage are represented as dots and with italic labels. Error bars and violin plots show standard deviations and normalized coverage distribution. The depths of rDNA regions are marked in red. For comparison, the data from representative single-copy BUSCO genes on RIR17 are shown in black. The mean depth of means from 243 BUSCOs is marked with a horizontal blue line, and the mean depth of all RIR17 bases is marked with a magenta line. The changes in the depth of rDNA regions are in vertical bold labels and square brackets. rDNA regions adapted for the copy number estimation (α- and β-regions) are marked in the inset with the depth of coverage and the GC content of each sequence position

