Fig. 2.
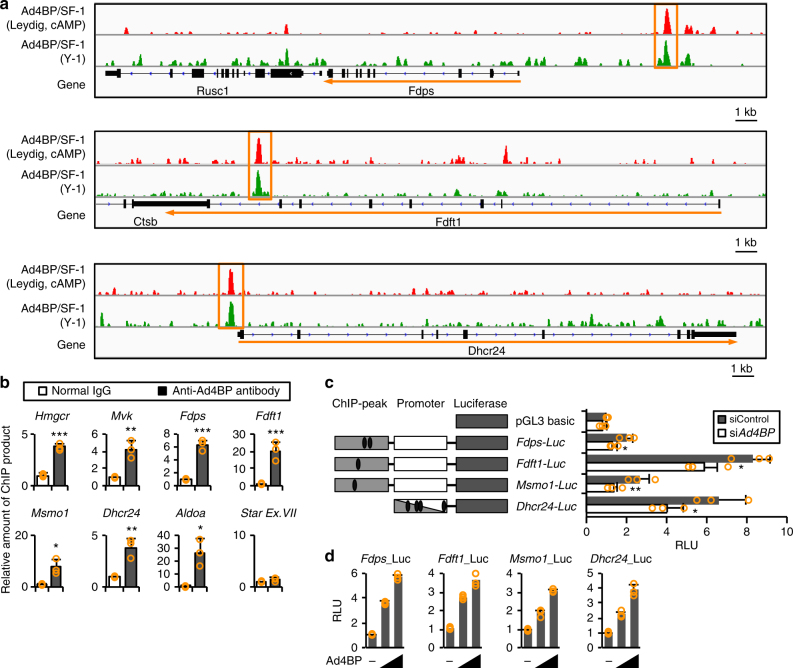
Regulation of cholesterogenic genes by Ad4BP/SF-1. a Ad4BP/SF-1 ChIP peaks in Y-1 and cAMP-treated Leydig cells are shown for the indicated cholesterogenic genes (Fdps, Fdft1, and Dhcr24). The ChIP peaks are enclosed by orange squares. Peaks for other cholesterogenic genes are shown in Supplementary Fig. 4. b Accumulation of Ad4BP/SF-1 on cholesterogenic genes was confirmed by ChIP-qPCR. Star Ex.VII was used as a negative control. *p < 0.05, **p < 0.01, and ***p < 0.005. n = 3. c Luciferase reporter gene constructs, Fdps-Luc, Fdft1-Luc, Msmo1-Luc, and Dhcr24-Luc, are shown (left). Gray squares represent genome fragments where accumulation of Ad4BP/SF-1 was observed by the ChIP-seq. White squares represent genome fragments corresponding to promoters of the genes. For Dhcr24, accumulation of Ad4BP/SF-1 was detected in the promoter region. Ovals represent potential Ad4BP/SF-1-binding sites. The reporters were transfected into Y-1 cells with siAd4BP/SF-1 or siControl. Average RLU (relative luciferase unit) values and SDs of the luciferase activities are indicated. The average value for pGL3 basic in the siControl-treated cells was normalized to 1.0. *p < 0.05 and **p < 0.01. n = 3. d The reporters were transfected into HeLa cells with increasing amounts of the expression vector for Ad4BP/SF-1. Average values for pGL3 basic in the absence of the Ad4BP/SF-1 expression vector were normalized to 1.0

