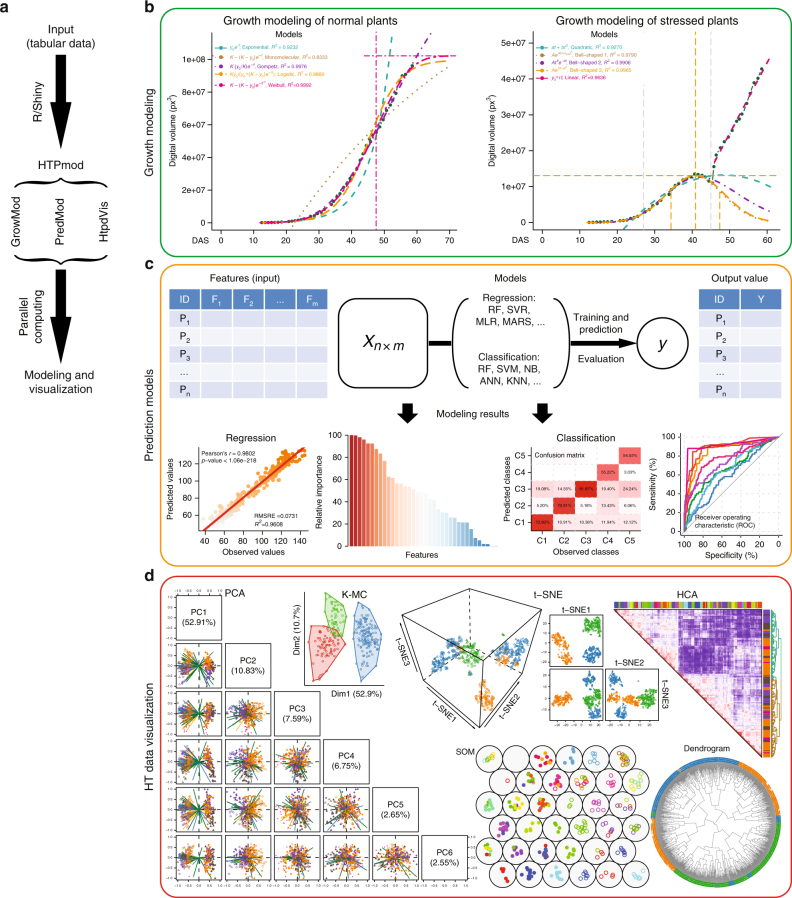
Fig. 1.
The HTPmod Shiny application for high-throughput data modeling and visualization. a The overall design and workflow of HTPmod. b The growMod module for plant growth modeling. Example results shown here are based on data from ref. 1. c The predMod application for predicting traits of interest from high-dimensional data using various prediction models. The upper panel shows the general workflow of predMod. The lower panel shows example output of regression (left) or classification (right) from predMod. d High-throughput data visualization with the htpdVis application. Example graphs are generated by htpdVis using data from refs. 1,25

