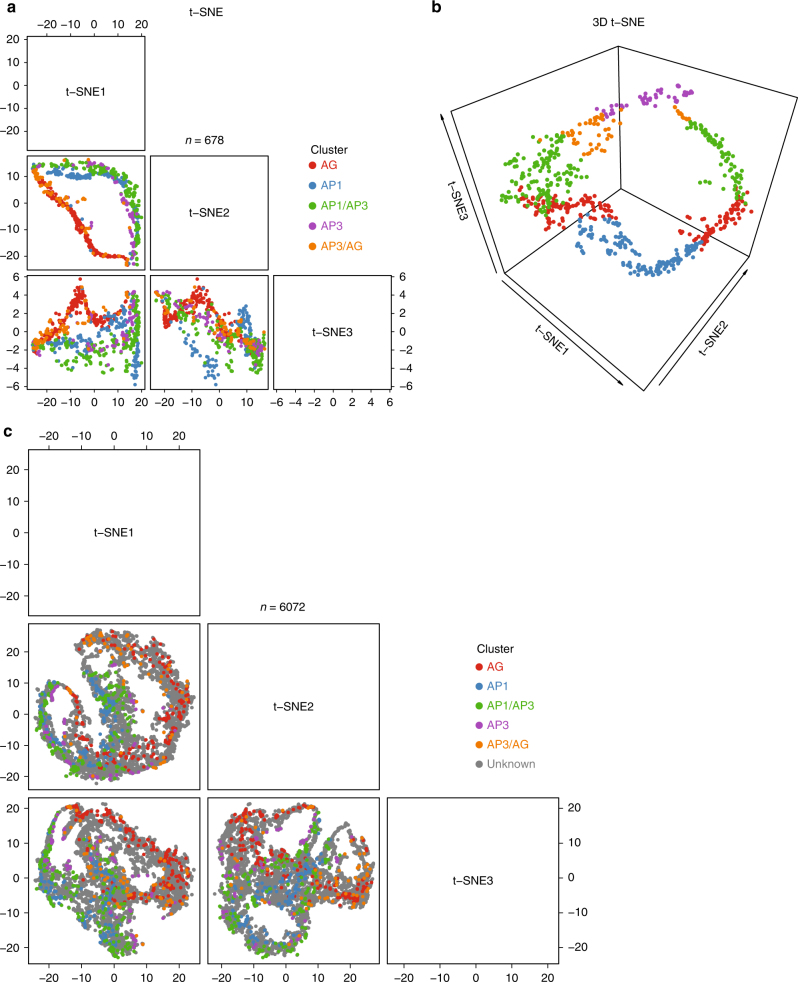
Fig. 4.
Visualization of floral organ-specific transcriptome data in Arabidopsis42 via t-SNE plots33 using htpdVis. The pattern of organ-specific expression for genes with known organ signature is shown in the three-dimensional t-SNE plots in 2D (a) or 3D (b) views. c t-SNE plot in 2D view showing organ-specific expression pattern by adding more genes with unknown organ signature. Default parameter settings were used in all of these analyses

