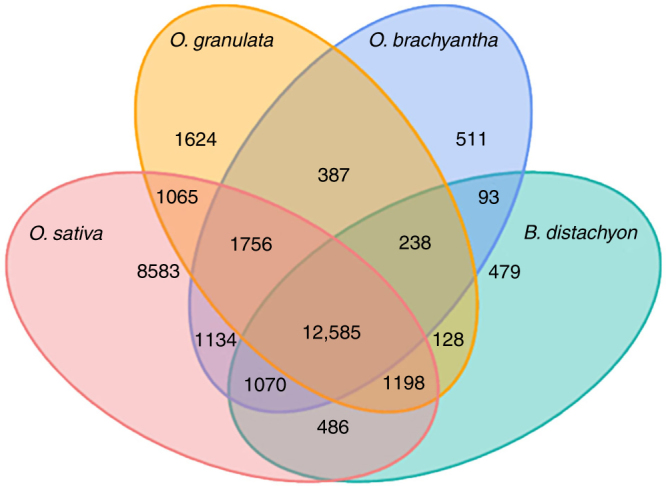
Fig. 4.

Venn diagram showing the distribution of gene families between O. granulata, O. brachyantha, O. sativa, and B. distachyon. The intersections between species indicate the numbers of shared gene families, while unique family numbers are shown in species-specific areas. The center represents the number of families shared by all species simultaneously. Only families with four or more protein members were considered. Analysis of families showed 12,585 families shared by all species simultaneously
