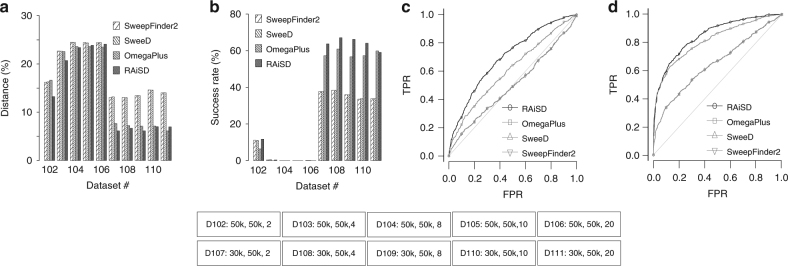
Fig. 3.
RAiSD evaluation and comparison with SweepFinder2, SweeD, and OmegaPlus, for the models with a recombination hotspot and a selective sweep. a Detection accuracy, measured as the average distance between the reported locations and the known target of selection (reported as a percentage over the region length). b Success rate, reported as the percentage of the runs with best-score location in the proximity (closer than 1% of the region length) of the known target of selection. c ROC curve for recombination model 102 (sweep location: 50 kb, center of recombination hotspot: 50 kb). d ROC curve for recombination model 107 (sweep location: 30 kb, center of recombination hotspot: 50 kb). The parameters that vary per model are provided below the plots in the form: “D[#]: [sweep location], [center of hotspot], [recombination intensity]”

