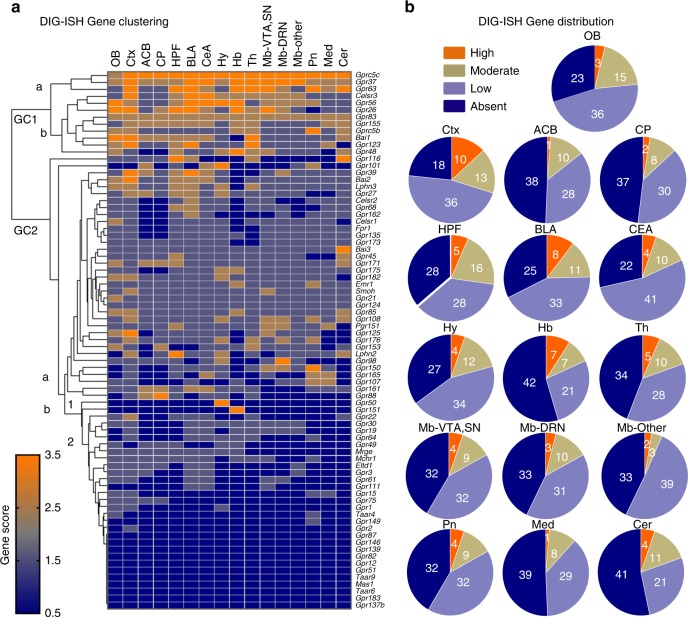
Fig. 2.
Clustering oGPCR distribution in the mouse brain. a, b Semi quantification of DIG-ISH mapping of oGPCRs in the adult mouse brain. a Heatmap showing hierarchical clustered distribution of oGPCRs (Gpr17 was not scored due to unvaried expression) mapped by scoring ISH images across 16 brain regions in the mouse. Gene cluster 1 (GC1) principally includes widespread oGPCRs with strong (GC1a) or moderate (GC1b) expression across the brain. Gene cluster 2 (GC2) essentially contains localized oGPCRs with moderate to high (GC2a and b1) or widespread low expression patterns (GC2a and b2) as well as absent oGPCRs (GC2b2). Color bar indicate 4 scoring levels of expression high (3.5, orange), moderate (2.5, brown), low (1.5, greyish blue) or absent (0.5, blue). b Pie charts illustrate oGPCR distribution (high/moderate/low/absent) according to the brain region (See Supplementary Data 2 for oGPCR listings). Annotated brain regions: OB, olfactory bulb; Ctx, cortex; ACB, nucleus accumbens; CP, caudate putamen; HPF, hippocampal formation; BLA, basal-lateral amygdala; CeA, central extended amygdala; Hy, hypothalamus; Hb, habenula;, Th, thalamus; Mb, midbrain; VTA, ventral tegmental area; SN, substantia nigra; DRN, dorsal raphe nucleus; Mb-other (general midbrain excluding aforementioned areas); Pn, pons; Med, medulla; Cer, cerebellum

