Fig. 3.
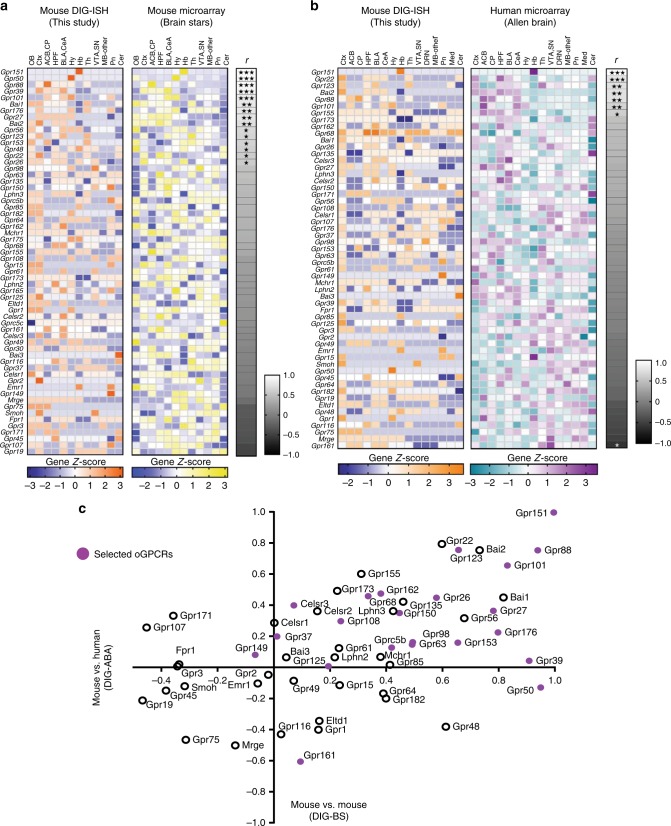
Correlation analyses of DIG-ISH data with public genome-wide microarray datasets. a Expression profiles for 60 oGPCR in 12 mouse brain regions, found in both mouse DIG-ISH data from this study (Left panel orange (high) to dark blue (low) and Fig. 2a) and mouse microarray data fro the BrainStar platform (http://brainstars.org/ BrainStars, Riken, Japan)35 (middle panel, yellow (high) to light blue (low)). b, Expression profiles for 56 oGPCRs in 15 brain regions, found in both DIG-ISH from this study (left, orange (high) to dark blue (low) color scale) and Allen Brain’s human data (middle, magenta (high) to cyan (low) color scale). a, b, Clustering shows best similar (top) to less-well correlated (bottom) oGPCR expression patterns. To the right of each oGPCR comparison, a grayscale gradient shows Pearson correlation coefficients (r) from positive (white) to inverse (black) correlation coefficients, scale −1 to 1.0. oGPCRs with statistically significant similar correlation coefficients are indicated as ***P < 0.001, **P < 0.01, *P < 0.05. Except for Gpr68 in b, no gene profile comparison showed significant difference according to students t-tests (Supplementary Table 1). OB, olfactory bulb; Ctx, cortex; ACB, nucleus accumbens; CP, caudate putamen; HPF, hippocampal formation; BLA, basal-lateral amygdala; CeA, central extended amygdala; Hy, hypothalamus; Hb, habenula; Th, thalamus; VTA, ventral tegmental area; SN, substantia nigra; Mb-other (general midbrain excluding aforementioned areas), Pn, pons; Cer, cerebellum. oGPCRs were excluded from analysis if the regional expression did not vary or the oGPCR was not found in the public dataset. c Correlation between Pearson coefficients for 56 shared oGPCRs in a, b is shown. The majority of oGPCRs (34) show positive correlations in both datasets (top right quadrant). Purple filled circles represent 23 of the 25 selected oGPCRs (Supplementary Table 2) for nanoString analysis in human brain samples. Gpr139 and Gprc5c were not available for correlation. Pearson correlation coefficient was statistically significant, r was 0.4987, ***P-value < 0.0001

