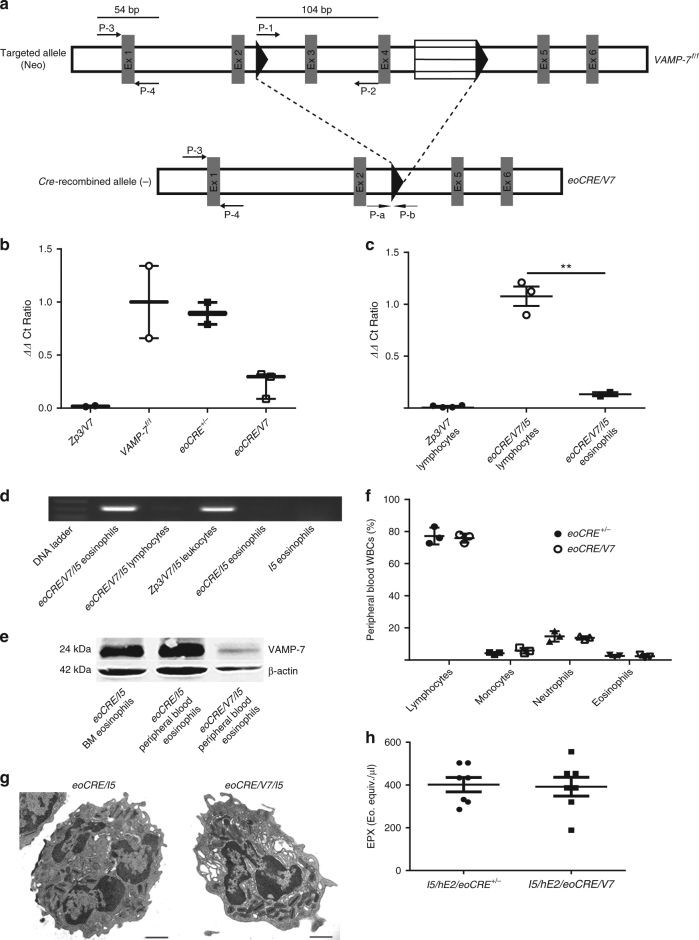
Fig. 2.
Eosinophil-specific VAMP-7 gene deletion in eoCRE/V7 mice confirmed by qPCR. a VAMP-7 gene deletion protocol used to generate eoCRE/V7 offspring. Amplicon values obtained from eoCRE/V7 offspring were compared to control VAMP-7f/f mice to generate ΔCt and ΔΔCt ratios as described in Methods section. Diagram adapted from Sato et al.32. b qPCR-quantified VAMP-7 gene deletion in bone marrow-derived eosinophils isolated from Zp3/V7, VAMP-7f/f, eoCRE+/−, and eoCRE/V7 mice. Low ΔΔCt values indicate VAMP-7 gene deletion. All data were normalized to VAMP-7f/f values. Data are presented as mean ± min-max range. c VAMP-7 gene excision efficiency between eosinophils and lymphocytes isolated from eoCRE/V7/I5 mice. Peripheral blood eosinophils (CCR3+/IL-5Rα+/Gr-1+/CD4−/B220−) and lymphocytes (CCR3−/IL-5Rα−/Gr-1−/CD4+/B220+) were analyzed from Zp3/V7 or eoCRE/V7/I5 mice. All data were normalized to the average ΔΔCt value for the eoCRE/V7/I5 lymphocyte population. Closed symbols indicate eoCRE+/− mice, open symbols indicate eoCRE/V7 mice. d VAMP-7-specific gene deletion was restricted to eoCRE/V7/I5-derived eosinophils. The P-a and P-b primer pair shown in (a) was used to detect expression of the deleted gene sequence (326 bps) in both eosinophils (CCR3+/IL-5Rα+/Gr-1+/CD4−/B220−) and lymphocytes (CCR3−/IL-5Rα−/Gr-1−/CD4+/B220+) isolated from eoCRE/V7/I5 mice. Expression profiles of the latter strain were compared to Zp3/V7/I5 whole-blood leukocytes, eoCRE/I5 eosinophils, and I5 eosinophils. e Western blot analysis of VAMP-7 protein expression in eoCRE/V7/I5-derived eosinophils (~96% purity), as well as in bone marrow-and peripheral blood-derived eosinophils from eoCRE/I5 mice. Gel was cropped to improve conciseness of presentation. f peripheral blood WBC profiles of eoCRE+/− and eoCRE/V7 mice. g Transmission electron microscopy images of peripheral blood eosinophils from eoCRE/I5 and eoCRE/V7/I5 mice. Scale bar, 1 μm. h EPX levels in BAL fluid from I5/hE2/eoCRE+/− and I5/hE2/eoCRE/V7 mice. For Fig. 2b, c, f, and h, n = 3–7 mice/experiment. Data are presented as mean ± SEM. For Fig. 2d, e, and g, one representative gel, blot, or image from three separate experiments is shown. **p < 0.01 (one-way ANOVA, Tukey’s)

