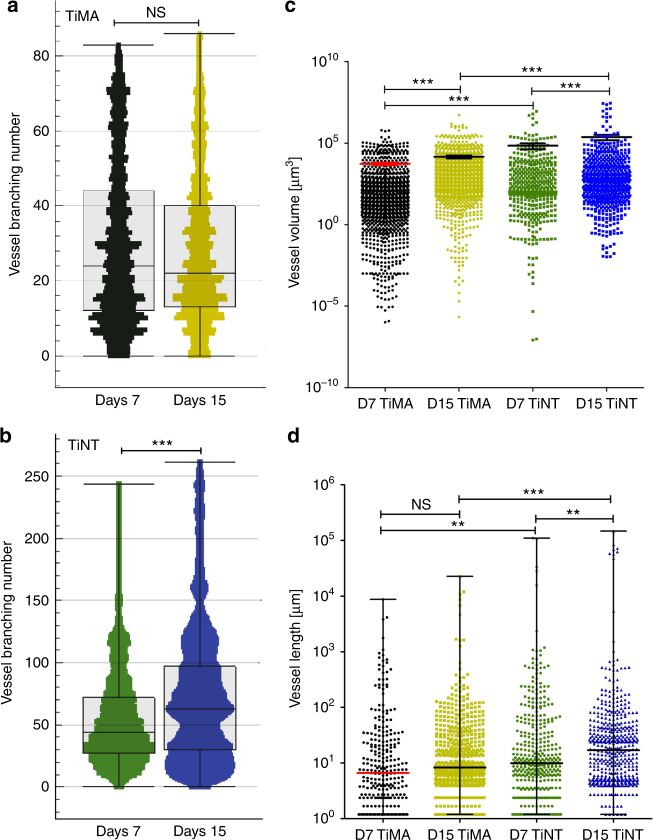
Fig. 8.
Comparison of the vascular morphometric parameters between implant types characterizing the features of the vessel network: branching number; vascular volume, and vessel length from day 7 to day 15 post-surgery. In all: Black = TiMA day 7; Gold = TiMA day 15; Green = TiNT day 7; Azure = TiNT day 15. Branching number of the network in a TiMA and b TiNT groups. Error bar = median ± IQR. n = 8 animals/group/time point. Mann–Whitney test was used to assess the statistical significance of the two medians ***P-value < 0.001. c comparison of the vessel volume in both TiMA and TiNT implant groups in day 7 and 15 post-surgery; error bar = mean ± SEM. d comparison of the vessel length in both TiMA and TiNT implant groups in day 7 and 15 post-surgery; error bar = median ± IQR. In c, d, n = 8 animals/group/time point. Kruskal–Wallis test was performed followed by a Dunn’s multiple comparison test. NS not significant, **P-value < 0.01, ***P-value < 0.001

