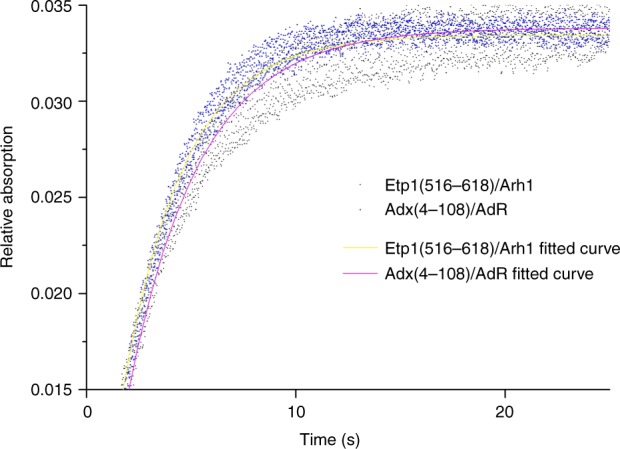
Fig. 8.

Averaged curves of stopped-flow measurement. Blue dots represent the Etp1(516–618)/Arh1 redox partner set, and black the Adx(4–108)/AdR set. Yellow and pink lines indicate the fitting, respectively. To analyze the stopped-flow reactions thoroughly, three to four replicates were averaged. The equations used were f(x) = a*(1−e−b*x), b describing the apparent rate constants (kapp) for the reduction of CYP106A2 by the two redox partner combinations Adx(4–108)/AdR or Etp1(516–618)/Arh were 0.292 and 0.343 s−1, respectively
