Fig. 3.
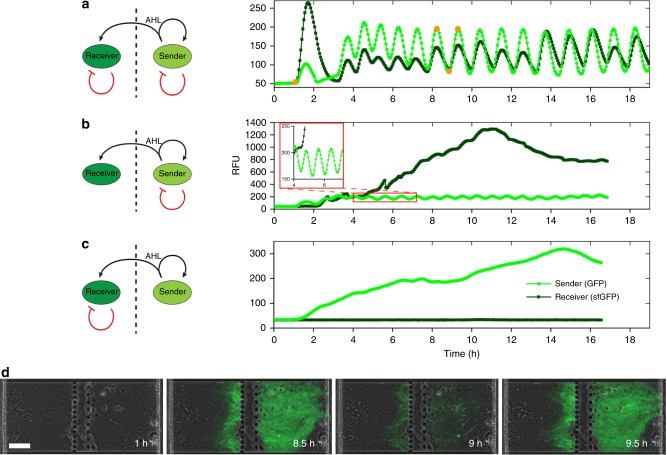
Synchronized oscillations in communicating populations. a Oscillations with negative feedback loops, induced by the AiiA lactonase in both sender and receiver populations. In the sender population, expression of the luxI, aiiA, and gfp genes is controlled by the lux promoter. LuxI enzymatically produces AHL, which activates the lux promoter. The AHL lactonase, AiiA, hydrolyzes AHL, providing the negative feedback. AHL diffuses into the receiver cells and induce production of sfGFP and AiiA. Mean fluorescence intensities in the traps as a function of time illustrate the oscillations. The light green curve shows oscillations of GFP in the sender cells, whereas the dark green curve shows oscillations of sfGFP in the receiver cells. b Absence of aiiA (negative feedback) in the receiver population resulted in the accumulation of sfGFP. c Absence of aiiA in the sender population resulted in the accumulation of the fluorescent protein, whereas in the receiver population, the continuous induction of aiiA resulted in the complete inhibition of the sfGFP production. d Phase contrast merged with fluorescent images of the cell populations in the microfluidic traps during the experiment described in (a), illustrating a dynamic communication at different phases of the oscillations. Time points at which the images were collected are shown in curve (a) as orange dots. Scale bar, 30 µm. In a, b, and c, the fluorescence intensity was collected from images taken of traps every third minute. Individual data points are shown as dots with connecting lines

