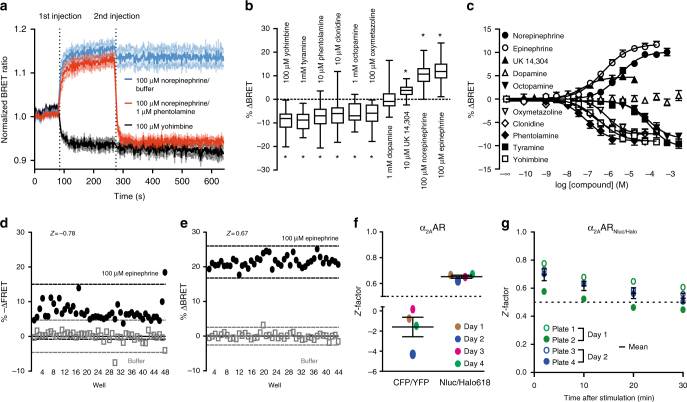
Fig. 2.
Pharmacological characterization of the α2AARNluc/Halo618 BRET-based biosensor, and evaluation of its applicability for microtiter plate screening. a Time-course of the normalized BRET ratio upon ligand stimulation (each N = 3). b Ligand-induced maximal BRET changes (Yohimbine: N = 7, Tyramine: N = 10, Phentolamine: N = 11, Clonidine: N = 10, Octopmaine: N = 5, Oxymetazoline: N = 6, Dopamine: N = 6, UK 14,304: N = 10, Norepinephrine: N = 25, Epinephrine: N = 23). c Concentration–response curves of different α2AAR ligands (Yohimbine: N = 7, Tyramine: N = 4, Phentolamine: N = 5, Clonidine: N = 4, Oxymetazoline: N = 4, Octopamine: N = 4, Dopamine: N = 4, UK 14,304: N = 3, Norepinephrine: N = 6,Epinephrine: N = 4). Comparison of the Z-factors for cells expressing the FRETCFP/YFP or BRETNluc/Halo sensor of α2AAR. d FRET or e BRET changes 2 min after 100 μM epinephrine or buffer stimulation are plotted for each well of representative plates and f the average values (each N = 4). g Z-factor at different time points after addition of 100 μM epinephrine or buffer (N = 4). Data show box and whisker plots (b) or mean ± s.e.m (a, c, f, g). Difference was analyzed by two-way ANOVA followed by Bonferroni post hoc test. *p ≤ 0.05 vs. buffer

