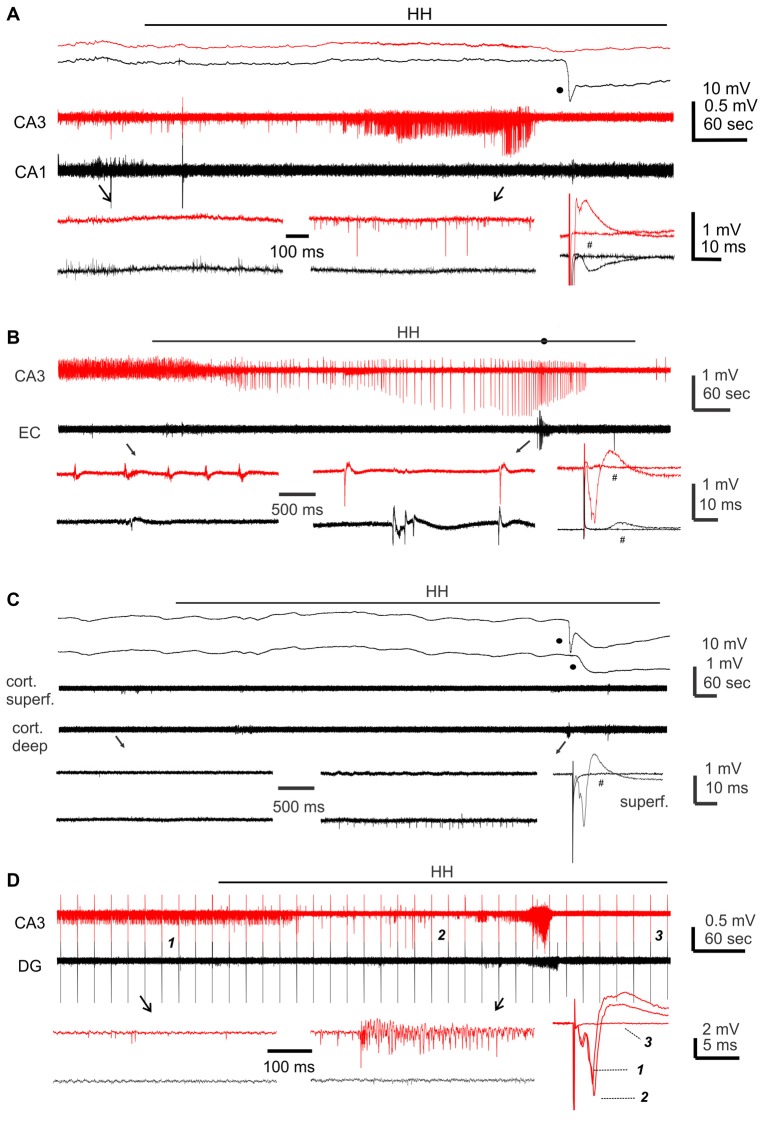
Figure 4.
Regional field potentials observed from brain slices following hypoxic-hypoglycemic (HH). Dual extracellular recordings made from indicated areas in brain slices of adult (A) or young mice (B–D). HH timings indicated by horizontal lines; anoxic depolarization (AD) responses denoted by filled circles. Field potentials evoked before and after HH termination (#) were superimposed at far right; illustrated traces were averages from 4 to 5 consecutive responses. (A,C) Top panel represent original signals that were sampled in a frequency range of 0–1,000 Hz; middle panel represent original signals after treatments with a band-pass filter (1–500 Hz); bottom panel represent expansion of arrowed data segments. (B,D) Signals similarly filtered and illustrated as in the middle and bottom panels of (A). In (D) constant afferent stimuli were applied every 20 s continuously; arrowed segments were expanded and numbered responses were superimposed at far right.

