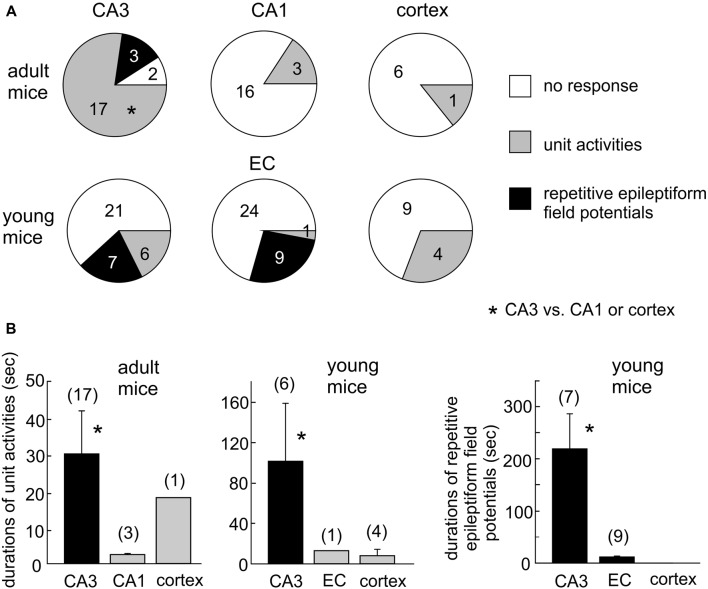
Figure 5.
Summary of HH-induced hyperexcitable responses in CA3 and other regions. (A) Proportions of slices with or without regional unit activities or epileptiform potentials following HH. *CA3 vs. CA1 or cortex. (B) Durations of regional unit activities or epileptiform potentials. *CA3 vs. CA1, entorhinal cortical (EC) or cortical area. Data in each measures were collected from three to eight mice.

