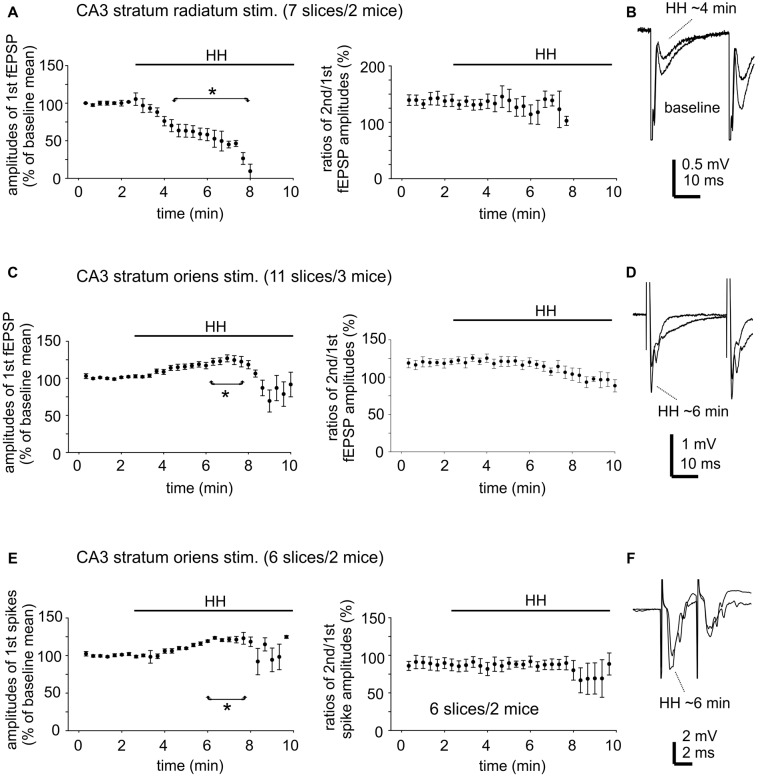
Figure 6.
Changes in CA3 evoked field potentials observed during HH. (A) CA3 fEPSPs evoked every 20 s repetitively by paired stimulation (inter-stimulation interval of 30 ms) of the CA3 striatum radium area. The amplitudes of the 1st fEPSPs and paired enhancements (ratio of the 2nd vs. the 1st fEPSPs) were measured and normalized as percentiles of baseline means. HH timing indicated by horizontal lines. *, HH vs. baseline values. (B) Examples of evoked responses collected before and following HH for about 4 min. Averages from four consecutive responses were illustrated. (C,D) CA3 fEPSPs were evoked by similar paired stimulation of the CA3 striatum oriens area. Data were similarly analyzed and presented as in (A,B). (E,F) CA3 population spikes evoked every 20 s repetitively by paired stimulation (inter-stimulation interval of 4 ms) of the CA3 striatum oriens area. Data were similarly analyzed and presented as in (A,B).

