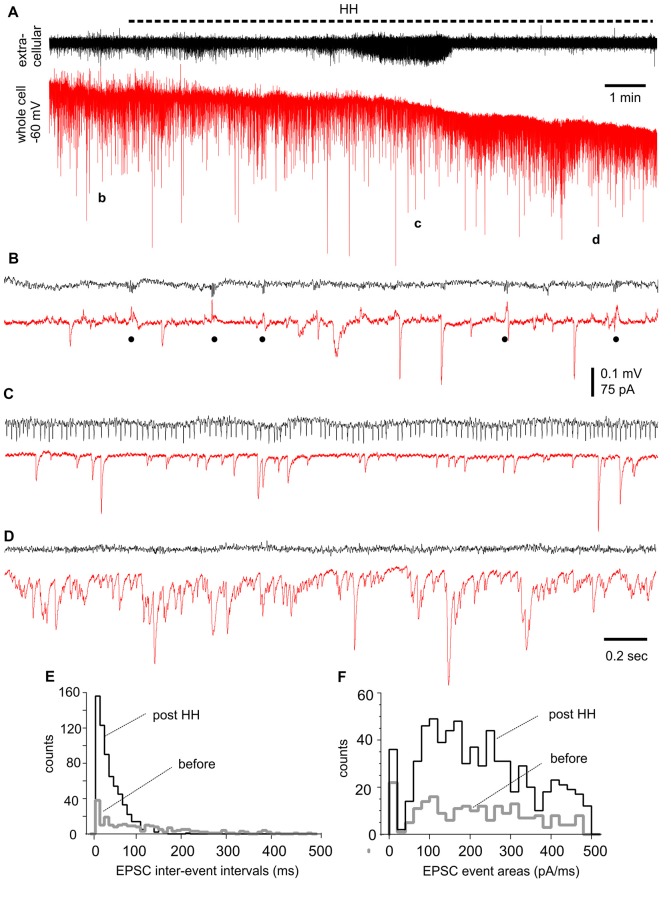
Figure 7.
Synaptic currents observed from a CA3 pyramidal neuron before and following HH. (A) Traces collected via whole-cell patch recordings from a CA3 pyramidal neuron concurrent with extracellular recordings of local field potentials. The neuron was voltage-clamped at −60 mV. HH timing was indicated by a dashed line above traces. Data segments denoted by “b,” “c” and “d” were expanded in (B–D), respectively. Filled circles in (B) indicate IPSCs. (E,F) Overlapped histograms show interval (E) and area (F) distributions of baseline and post-HH EPSCs (n = 149 and 554 events; bin size 10 ms or 20 pA/ms).

