Fig. 4.
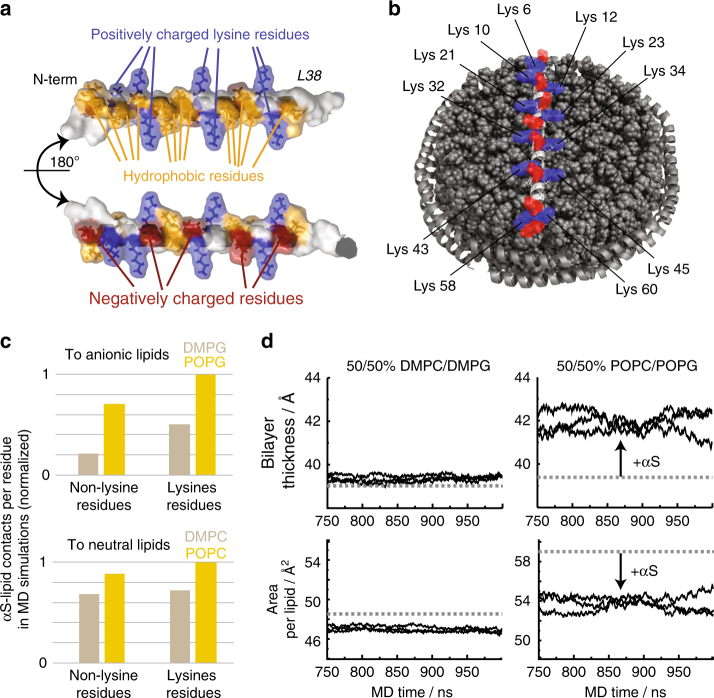
αS–lipid interaction potentially modulates membrane plasticity. a Molecular features of αS’s key lipid binding mode (residues 1–38), including periodically and symmetrically appearing lysine residues (blue) that form a positively charged “grid” (see text for more details). b Model of αS1-61-nanodisc interaction (drawn to scale), lysine (blue) and negatively charged residues (red) are highlighted. c αS-to-lipid contacts ( < 4 Å) per residue as occurring during the time course of MD simulations. Normalized values for interactions with anionic lipids (upper diagram) or neutral lipids (lower diagram) differentiating between lysines and all other residues as well as between gel/fluid-phase membranes (beige/yellow bars), respectively. d Bilayer thickness (upper panels) and area per lipid (lower panels) during the end of MD simulations in the presence (solid lines, three independent simulations) and in the absence of αS (dashed line). While simulations in the gel phase show no considerable effect (d, left panels), a clear trend toward a more ordered state for the fluid phase membrane, induced by the presence of αS, is visible by an increase bilayer thickness and reduced area per lipid (d, right panels)

