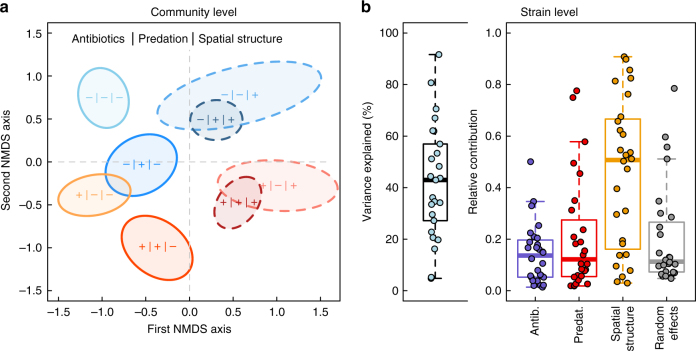
Fig. 2.
a Clustering of microbial communities (based on sample proximity in random forest classification) according to experimental design (N = 96). The +/– indicates the presence/absence of a particular treatment. Color codes for antibiotics (red/blue), color shade codes for predation (dark/light), and line style codes for spatial structure (continuous/dashed). b A hierarchical model of species communities (HMDS) of strain occurrence (strain traits account for 11% of variation in co-occurrence, after controlling for phylogenetic similarity) is able to capture about 20–90% (median 43%) of the variation (left panel), depending on the strains (low values around 5% are due to strain occurring in all samples; N = 96). Within the explained variation, strains also differ considerably in how they respond to the experimental treatments (right panel). Most variation is seen in the response to spatial structuring and this fraction tends to be negatively associated with the total fraction of variance explained (ρ = –0.38)

