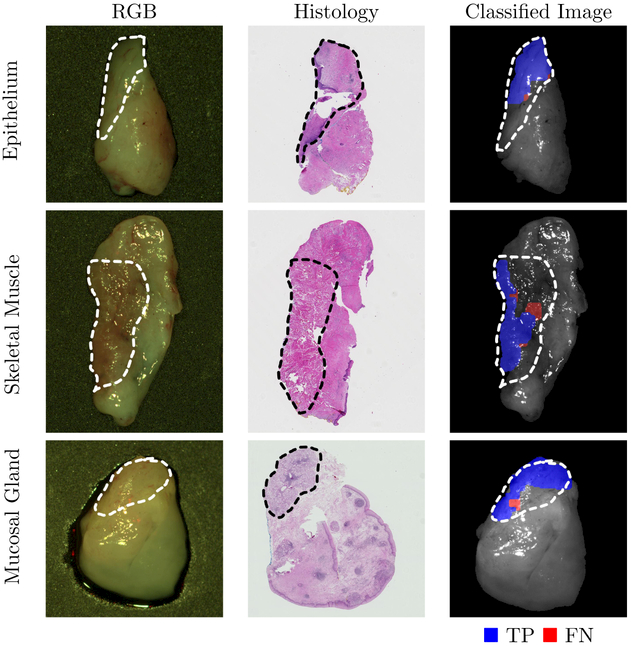
Figure 4:
Representative results of sub-classification of normal oral tissues. Left: HSI-RGB composites are shown with ROI of the tissue type outlined. Center: Respective histological gold standard with corresponding ROI outlined. Right: Artificially colored CNN classification results of the ROI only. True positive results representing correct tissue-subtype are visualized in blue, and false negatives are shown in red. Tissue within the ROI that is shown in grayscale represents tissue that is not classified due to glare pixels or insufficient area to produce the necessary patch-size.

