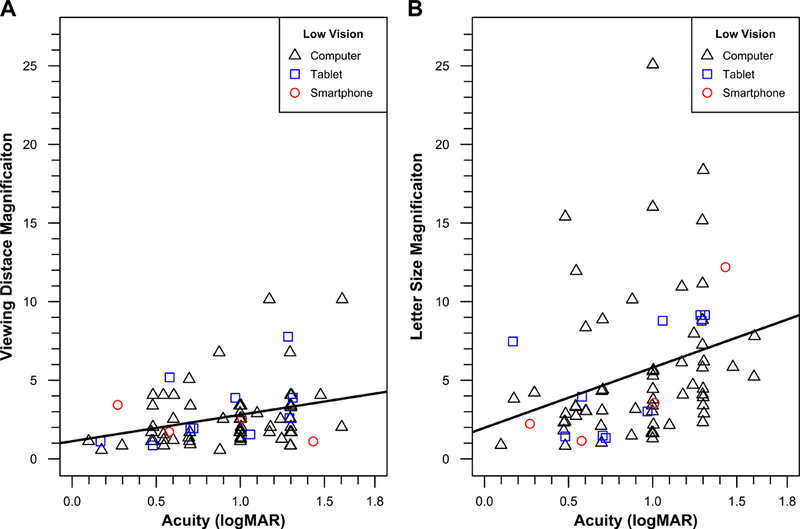
Figure 5.

Magnification factors for 75 low-vision subjects. (A) Scatterplot of Viewing-Distance Magnification vs. Acuity. The equation for the regression line is y = 1.12 + 1.68x. (B) Scatterplot of Letter-Size Magnification vs. Acuity. The equation for the regression line is y = 2.00 + 4.01x. The open triangles, squares and circles show data for computer, tablet and smartphone displays respectively.
