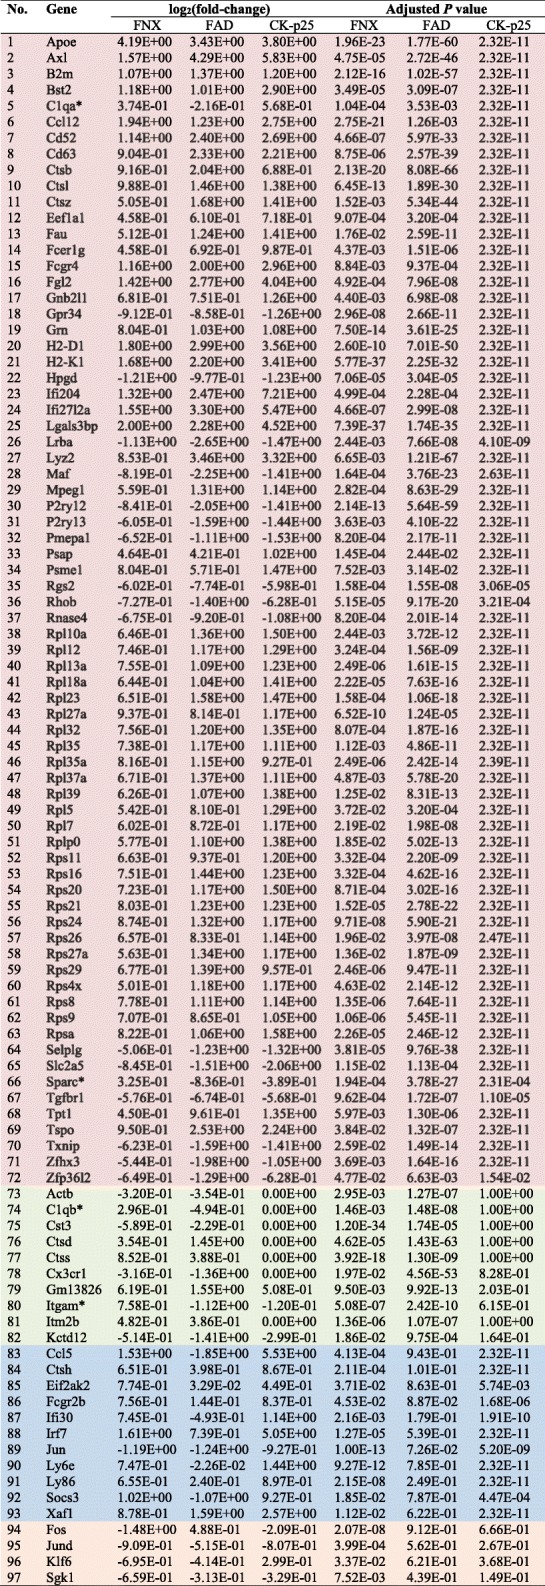
Table 2.
Microglia regulated disease-associated genes in models of neurodegeneration

Color code corresponds to Fig. 2c: common to FNX, FAD and CK-p25 (red); common to FNX and FAD (green); common to FNX and CK-p25 (blue); only regulated in FNX (orange). Negative values represent down-regulation. Asterisk (*) indicates different directionality of commonly regulated genes
