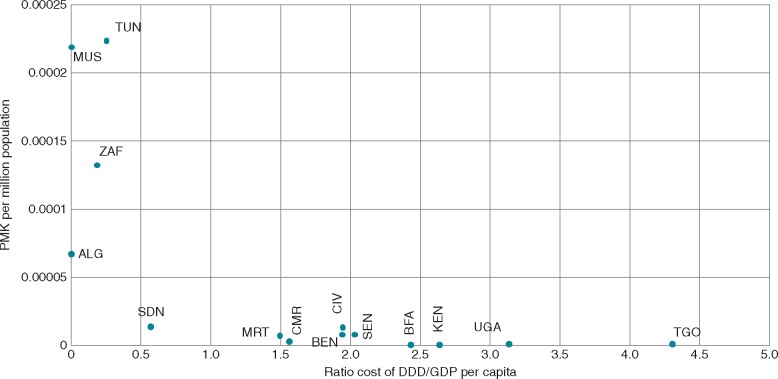
Figure 8.
Pacemaker implantation rate per ratio of implantation cost on GDP per capita. Pacemaker implantation cost rated by GDP per capita informed about the expense carried by such procedure regarding the population average wealth. The figure shows that countries with low ratio (mainly because of the existence of public health care insurance) tend to have higher pacemaker rate. ALG, Algeria; BEN, Benin; BFA, Burkina Faso; CMR, Cameroon; CIV, Ivory Coast; EGY, Egypt; KEN, Kenya; MAR, Morocco; MUS, Mauritius; NGA, Nigeria; SDN, Sudan; SEN, Senegal; TGO, Togo; TUN, Tunisia; ZAF, South Africa Republic.

