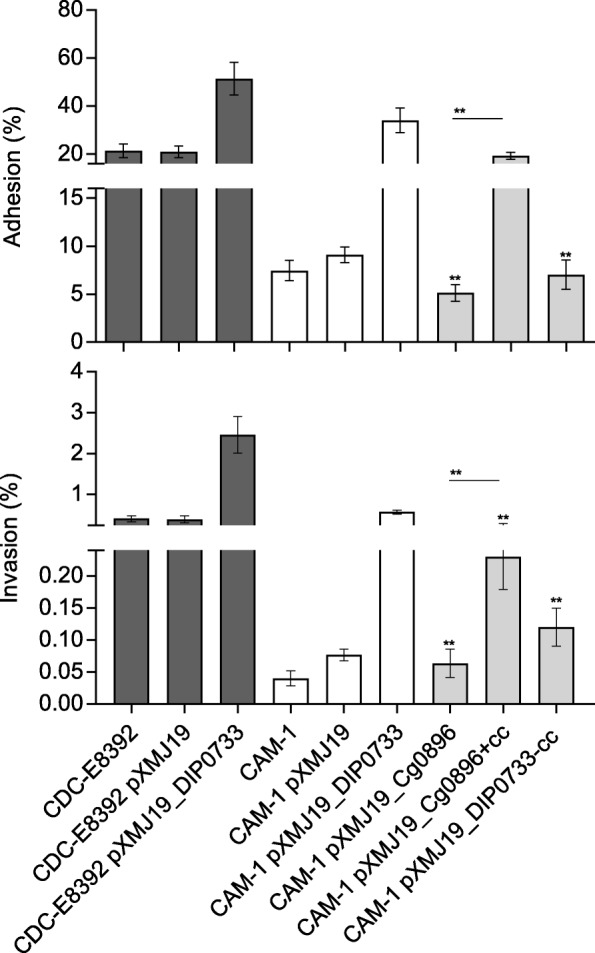
Fig. 3.

Adhesion to and invasion of epithelial cells. Dark grey and white columns represent reproduced assays with strains previously showed by [14]. Grey columns represent the assays performed with new constructs for different truncated DIP0733 homologs (see Fig. 1). Statistically relevant differences between CAM-1 pXMJ19_DIP0733 and its respective truncated forms (light grey columns) were based on Unpaired Student’s t-test. Values below 0.05, 0.01, 0.001 and 0.0001 are indicated by one, two, three and four asterisks, respectively. Adhesion and invasion are expressed as percentage of the inoculum, showing means and SD of at least three independent biological replicates
