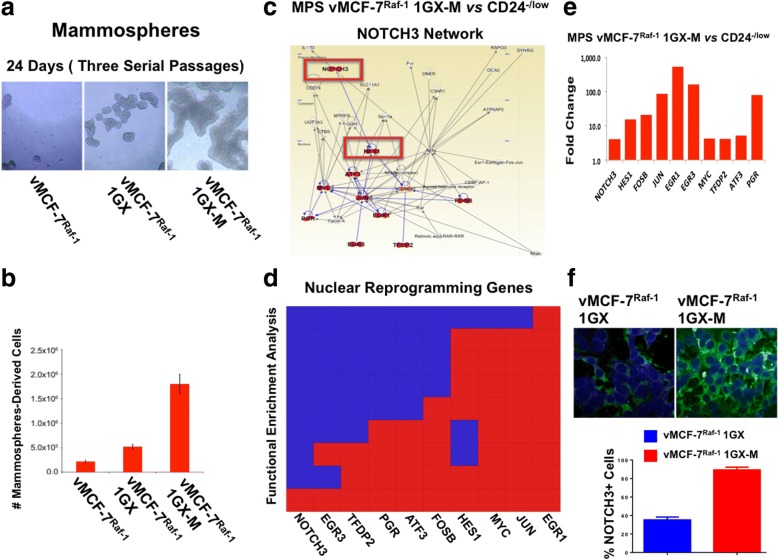
Fig. 3.
Self-renewal capacity and transcriptomic characterization of metastatic breast cancer cells. a Representative images of light microscopic analysis showing mammosphere (MPS) formation from vMCF-7∆Raf1, vMCF-7∆Raf1 1GX, and vMCF-7∆Raf1 1GX-M breast cancer cells after 24 days of culture under nonadherent conditions (three serial passages). b Graph showing the percentage of vMCF-7∆Raf1, vMCF-7∆Raf1 1GX, and vMCF-7∆Raf1 1GX-M breast cancer cells isolated from MPS after 24 days of culture under nonadherent conditions (three serial passages) from three independent experiments (± SD). c In Silico comparative gene network analysis between CD24−/low (isolated from vMCF-7Raf-1 1GX cells) and MPS vMCF-7Raf-1 1GX-M cells using Ingenuity Pathway Analysis software showed upregulation of a noncanonical NOTCH3 reprogramming network that was upregulated in MPS vMCF-7Raf-1 1GX-M cells. d In silico comparative functional enrichment analysis between CD24−/low (isolated from vMCF-7Raf-1 1GX cells) and MPS vMCF-7Raf-1 1GX-M cells. e Graph showing the difference in the expression of genes identified in the NOTCH3 network between MPS vMCF-7Raf-1 1GX-M and CD24−/low cells. f Immunofluorescence analysis showing representative images of vMCF-7∆Raf1 1GX and vMCF-7∆Raf1 1GX-M cells stained in green with a NOTCH3 polyclonal antibody. Nuclei were stained in blue with 4′,6-diamidino-2-phenylindole. Graph showing the average of NOTCH3-expressing cells from three independent experiments (± SD)

